


BITCOIN – LEVELS TO WATCH
-
 Traders,
We dumped. Now we are in a controlled recovery. The question is not only “are we going up” but “where will the market make its real decision.” Right now the chart is giving us two very clean checkpoints.
- What happened
We lost the weekly open and sold off.
Spot was selling too, so the dump was real.
After the low, spot started buying again and price reclaimed above the big wick. That looks like a failed attempt lower.
Markets left a really weak low behind at ~99k. I am convinced we will sweep this low somewhere in the coming weeks.
Funding is negative while price is moving up. Shorts are still in the market. This is how squeezes start.- First decision zone: 107.300 to 108.000
This area is important because several things come together.
107.300 is a weak high. It stopped at a clean level without strong rejection. That often means liquidity is still sitting above it.
The AVWAP anchored from 7 April is there. Price is below it for the first time since that move. When price comes back into an AVWAP from below the market often reacts because old buyers meet new sellers.
We also have an LVN just below. That tells us the market did not trade much there before. Price likes to test that kind of gap.
So 107k to 108k is our first place to watch the data. If spot keeps pushing and perps do not start selling we can break it. If CVD stalls there it can be a take profit zone.- Accumulation and Distribution
On both the 1 hour and 4 hour spot charts the Accumulation/Distribution line tells an important story.
Price made a clear new low after the dump.
The A/D line did not make a new low. It actually started to turn up.
That is what traders call a bullish divergence. Price is still falling but the money flow is already improving.
In simple words. While candles were going down someone was quietly buying.
That means the bounce we see now is not just short covering or a random spike. It was prepared by real spot demand.
Futures can show a similar thing but spot is the cleaner signal because it is not influenced by funding, leverage or hedges.
When real buyers step in while shorts are still in the market it often creates the right conditions for a squeeze.- OBV check
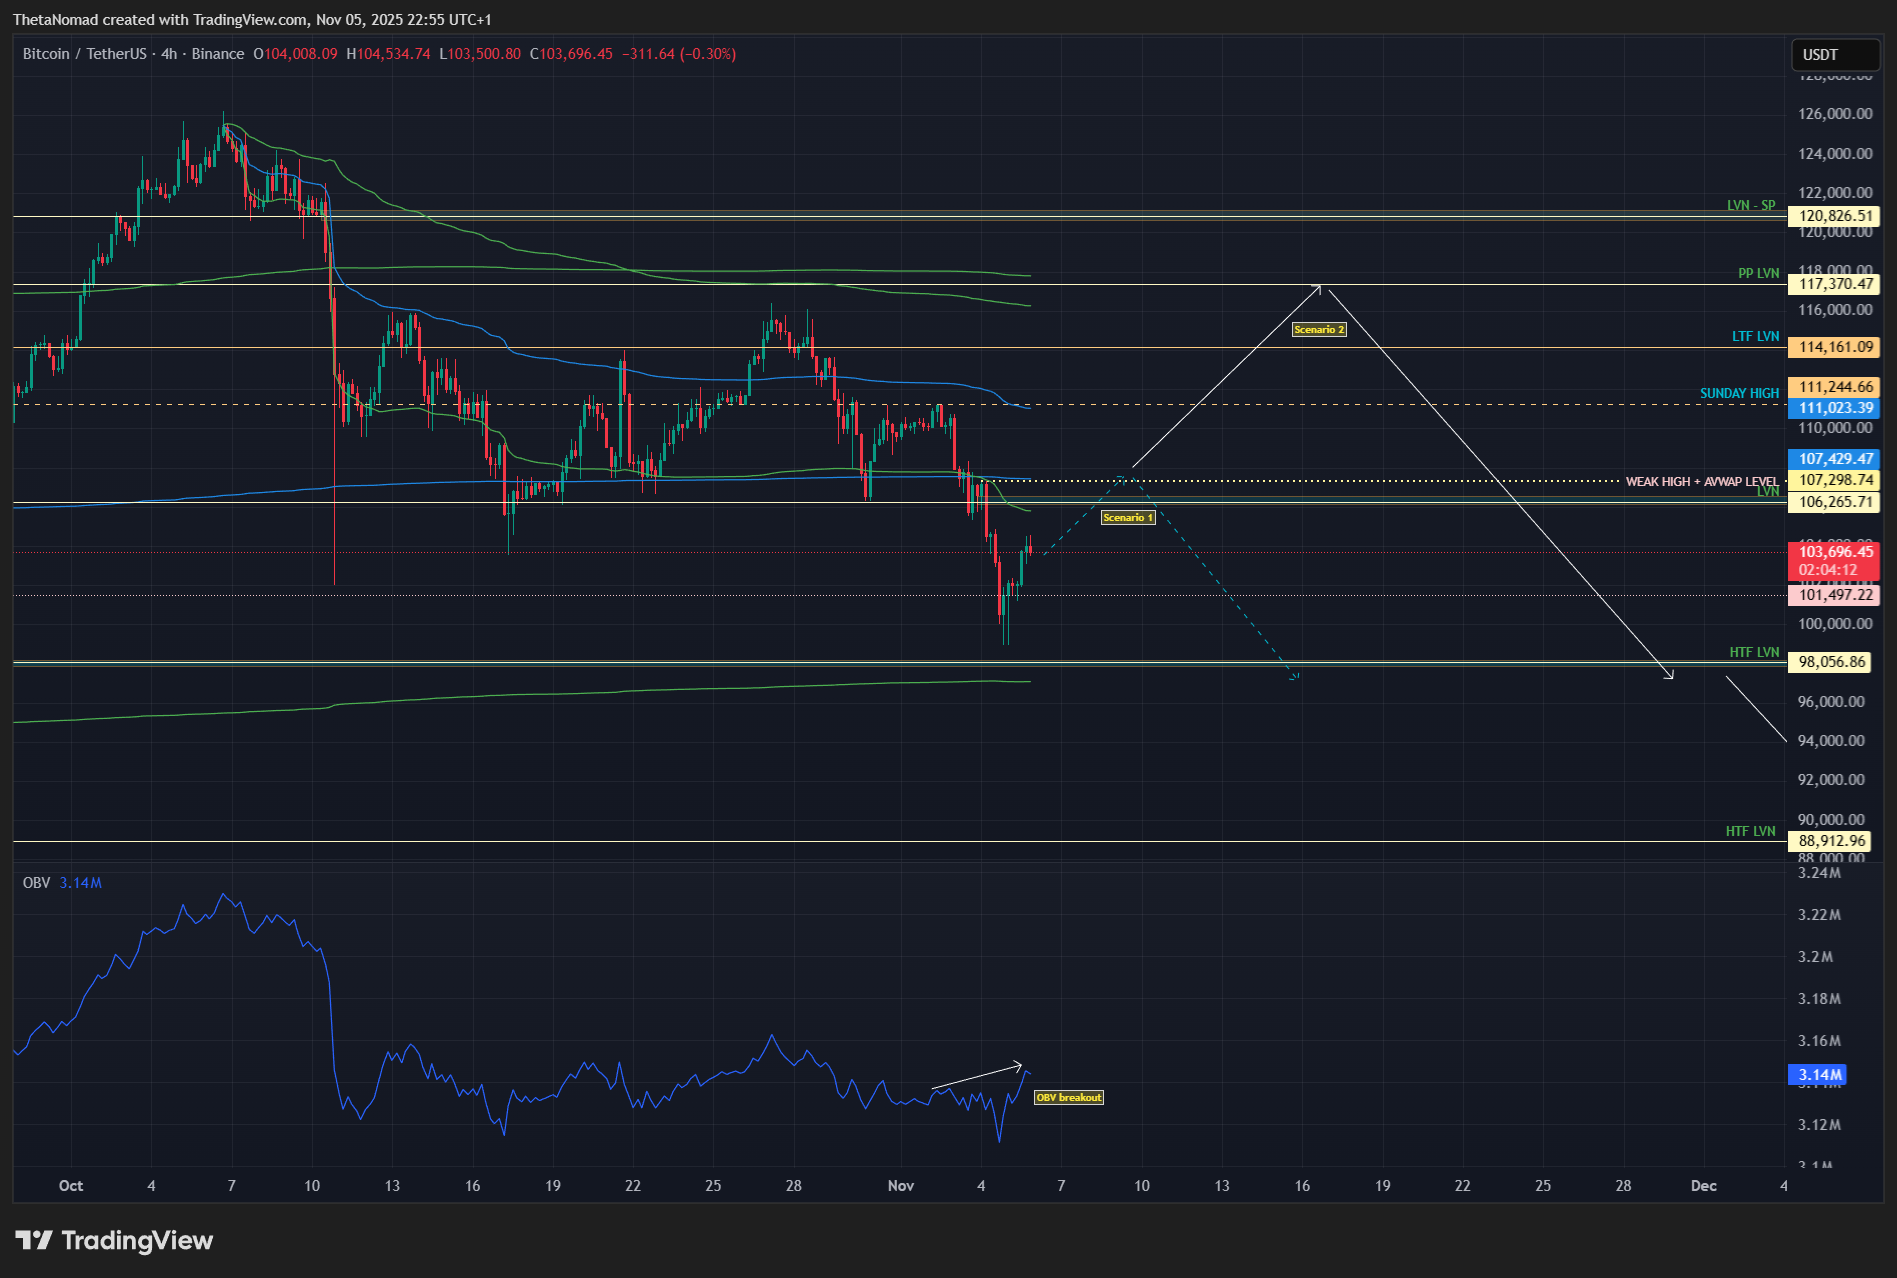
On the 4h OBV you can see it popping up from the base after the dump. OBV going up while price is moving up means volume is supporting the move. This agrees with the spot A/D story. It is better when price and OBV move together than when price moves alone.
- Scenario 1
Price pushes into 107k to 108k.
That sweep takes the weak high and tags the AVWAP.
If at that point spot CVD slows down or perps start to sell we can reject.
A rejection there can send price back into the mid zone and even lower towards 101k to 102k and in extension back to the HTF LVN near 98k.
This is the simple “first resistance holds” idea.- Scenario 2
This is the one I am leaning toward.
Price breaks and holds above 108k.
Shorts do not get their reaction.
Spot keeps supporting and funding stays negative to flat.
Then the market has room to go for the next real liquidity pool which is 117k to 118k.- Why 117k to 118k matters
On the liquidity heatmap there is clear resting liquidity higher up. Price often travels to those areas because that is where orders are.
The golden pocket of the previous move sits in this same zone. Many traders watch this fib area so reactions there are common.
Several AVWAP bands from earlier dates are meeting around 117k to 118k. When AVWAPs from different anchors cluster together it creates a stronger level because different groups of traders all care about that price.
Between the current price and that zone there are imbalances and LVNs. That means the market moved quickly there before and did not build volume. These thin areas often get filled on the next push.- How to read it in real time
Above 108k and spot CVD still rising means squeeze is on.
Above 108k and funding still negative means shorts are paying to stay wrong.
Lose 108k again after a sweep and see CVD roll over means scenario 1 is playing.
Price can just dump down without getting more liquidity. But looking unlikely based on the data right now.So if Bitcoin can break and hold above 108k there is not much in the way until 117k to 118k.
Final view
We dumped on real flow.
We are recovering with spot support.
We have a clear first test at 107k to 108k.
Break and hold and the magnet becomes 117k to 118k because of liquidity, golden pocket, AVWAP confluence and imbalance.TLDR;
Bitcoin sold off hard, but the data says the low was bought. Spot A/D started rising while price was still making new lows, funding turned negative and price reclaimed above the wick, which tells us real buyers stepped in while shorts stayed in their positions. Now price is climbing back toward 107k to 108k where a weak high and the April AVWAP are waiting, so that is the first place the market can decide if this recovery is just a bounce or the start of a squeeze. If buyers keep showing up there and we push through, the path above is thin and the next real pocket of liquidity, AVWAP confluence, imbalance and even the golden pocket of the earlier move all sit together around 117k to 118k. That is why this recovery matters. It is not just candles going up. It is positioning, spot flow and liquidity all lining up.
-
Still respecting the 200MA — structure looks healthy.

