Skip to content
  • Categories
  • Recent
  • Tags
  • Popular
  • World
  • Users
  • Groups
Collapse
Brand Logo
UDS UDS: $2.1757
24h: -1.82%
Trade UDS
Gate.io
Gate.io
UDS / USDT
KuCoin
KuCoin
UDS / USDT
MEXC
MEXC
UDS / USDT
BingX
BingX
UDS / USDT
BitMart
BitMart
UDS / USDT
LBank
LBank
UDS / USDT
XT.COM
XT.COM
UDS / USDT
Uniswap v3
Uniswap v3
UDS / USDT
Biconomy.com
Biconomy.com
UDS / USDT
WEEX
WEEX
UDS / USDT
PancakeSwap v3
PancakeSwap v3
UDS / USDT
Pionex
Pionex
UDS / USDT
COINSTORE
COINSTORE
UDS / USDT
Sushiswap v3
Sushiswap v3
UDS / USDT
Picol
Picol
UDS / USDT

Earn up to 50 UDS per post

Post in Forum to earn rewards!

Learn more
UDS Right

Spin your Wheel of Fortune!

Earn or purchase spins to test your luck. Spin the Wheel of Fortune and win amazing prizes!

Spin now
Wheel of Fortune
selector
wheel
Spin

Paired Staking

Stake $UDS
APR icon Earn up to 50% APR
NFT icon Boost earnings with NFTs
Earn icon Play, HODL & earn more
Stake $UDS
Stake $UDS
UDS Left

Buy UDS!

Buy UDS with popular exchanges! Make purchases and claim rewards!

Buy UDS
UDS Right

Post in Forum to earn rewards!

UDS Rewards
  1. Home
  2. Trading
  3. Bitcoin Drops Below 100K, Reversal Signal Emerging

Bitcoin Drops Below 100K, Reversal Signal Emerging

Scheduled Pinned Locked Moved Trading
3 Posts 3 Posters 3 Views
  • Oldest to Newest
  • Newest to Oldest
  • Most Votes
Reply
  • Reply as topic
This topic has been deleted. Only users with topic management privileges can see it.
  • cryptobroC Offline
    cryptobroC Offline
    cryptobro
    wrote on last edited by
    #1

    After breaking below the 107K support level, Bitcoin retested the area and then extended its decline.
    As the downtrend intensified, the price broke through 102K, which was the low recorded during the large-scale liquidation event on October 11, and subsequently lost the psychological support level at 100K. f27e453a-5508-4147-aa98-be1725e7f60b-image.png

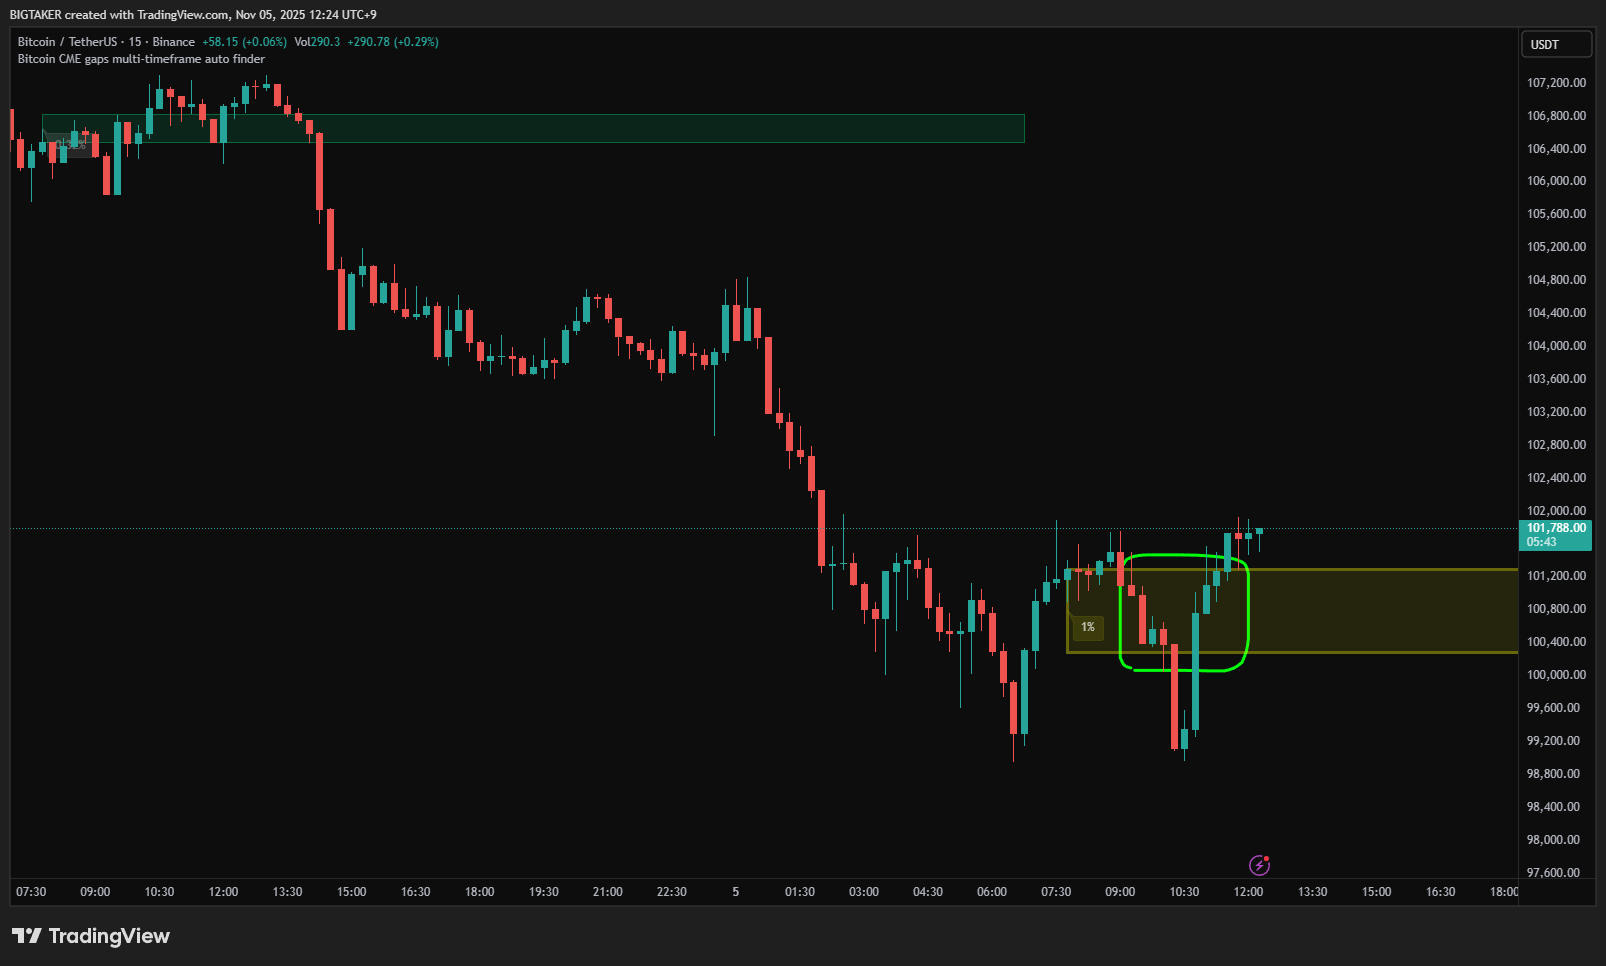
    During the eight-hour period of this decline, approximately 1.1 billion USD worth of long positions were liquidated, accompanied by both a liquidity sweep and a fakeout pattern.
    The simultaneous occurrence of large-scale liquidations, increased trading volume, a fakeout pattern, and the process of filling the CME gap indicates that multiple short-term reversal signals emerged in this zone.

    From a technical standpoint, there is an increasing likelihood of two consecutive bullish candles with long lower wicks forming on the 4-hour chart, while the 12-hour chart also shows a high probability of developing a bullish candle with a long lower shadow.

    This suggests a growing possibility of a short-term rebound, with the potential upside target near the upper boundary of the descending parallel channel.

    1 Reply Last reply
    0
    • A Offline
      A Offline
      alex10
      wrote on last edited by
      #2

      Big players accumulating quietly β€” sentiment doesn’t match the data. πŸ‘€

      1 Reply Last reply
      0
      • Nahid HossenN Offline
        Nahid HossenN Offline
        Nahid Hossen
        wrote on last edited by
        #3

        Market psychology at play β€” fear often marks opportunity. 🧠

        Nike

        1 Reply Last reply
        0


        • Login or register to search.
        Powered by NodeBB Contributors
        • First post
          Last post
        0
        • Categories
        • Recent
        • Tags
        • Popular
        • World
        • Users
        • Groups