


Gold looking for another mega bullish
-
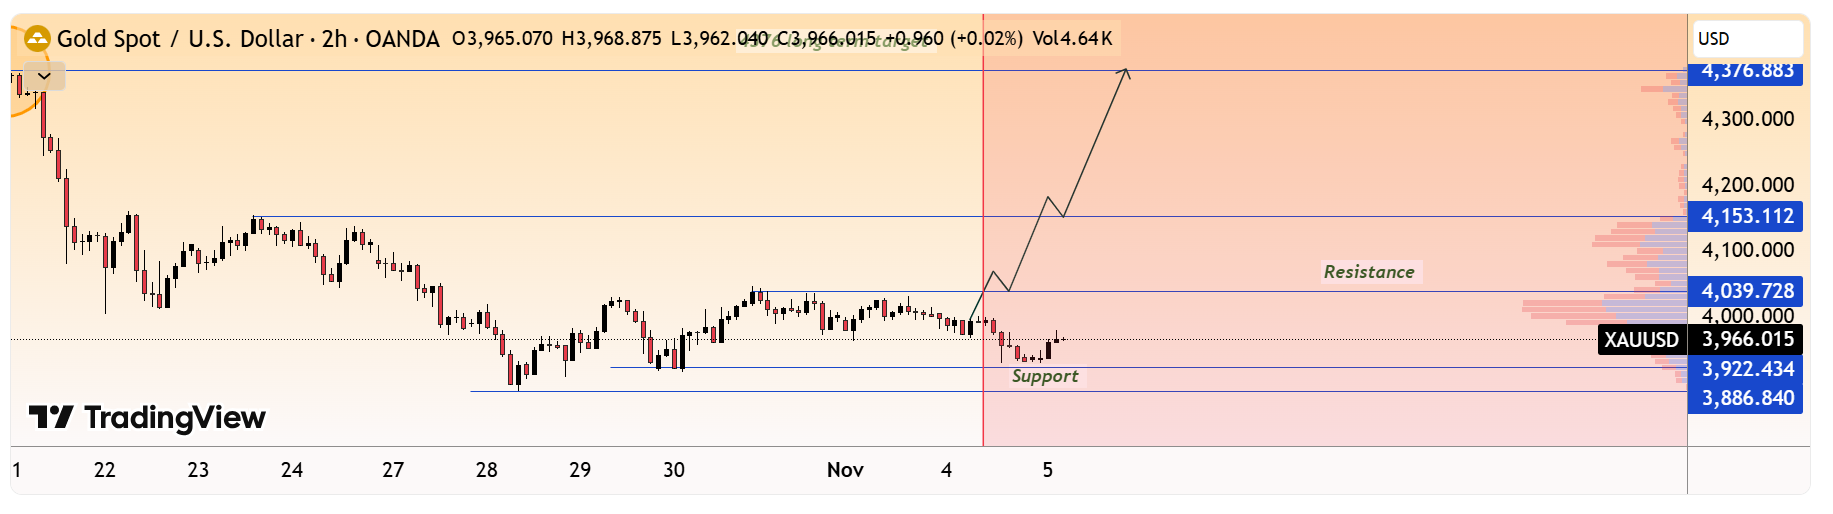 This XAU/USD (Gold vs USD) 2-hour chart shows a consolidation phase between the support zone around 3,922 – 3,886 and the resistance level near 4,039 – 4,153. The price is currently trading near 3,994, indicating indecision before a potential breakout.
If gold holds above the support area, the chart suggests a possible bullish breakout above resistance, leading to a continuation toward the long-term target at 4,376. The upward arrows outline a projected move with minor pullbacks, showing step-by-step momentum building toward the target.
In summary, as long as price remains above support, the bias stays bullish, with confirmation coming from a clear breakout above the 4,040–4,150 resistance zone.
-
If this breakout holds, 2025 could be gold’s defining run.

