


BNB Forming Head & Shoulders Breakdown Within Descending Channel
-
Hi!
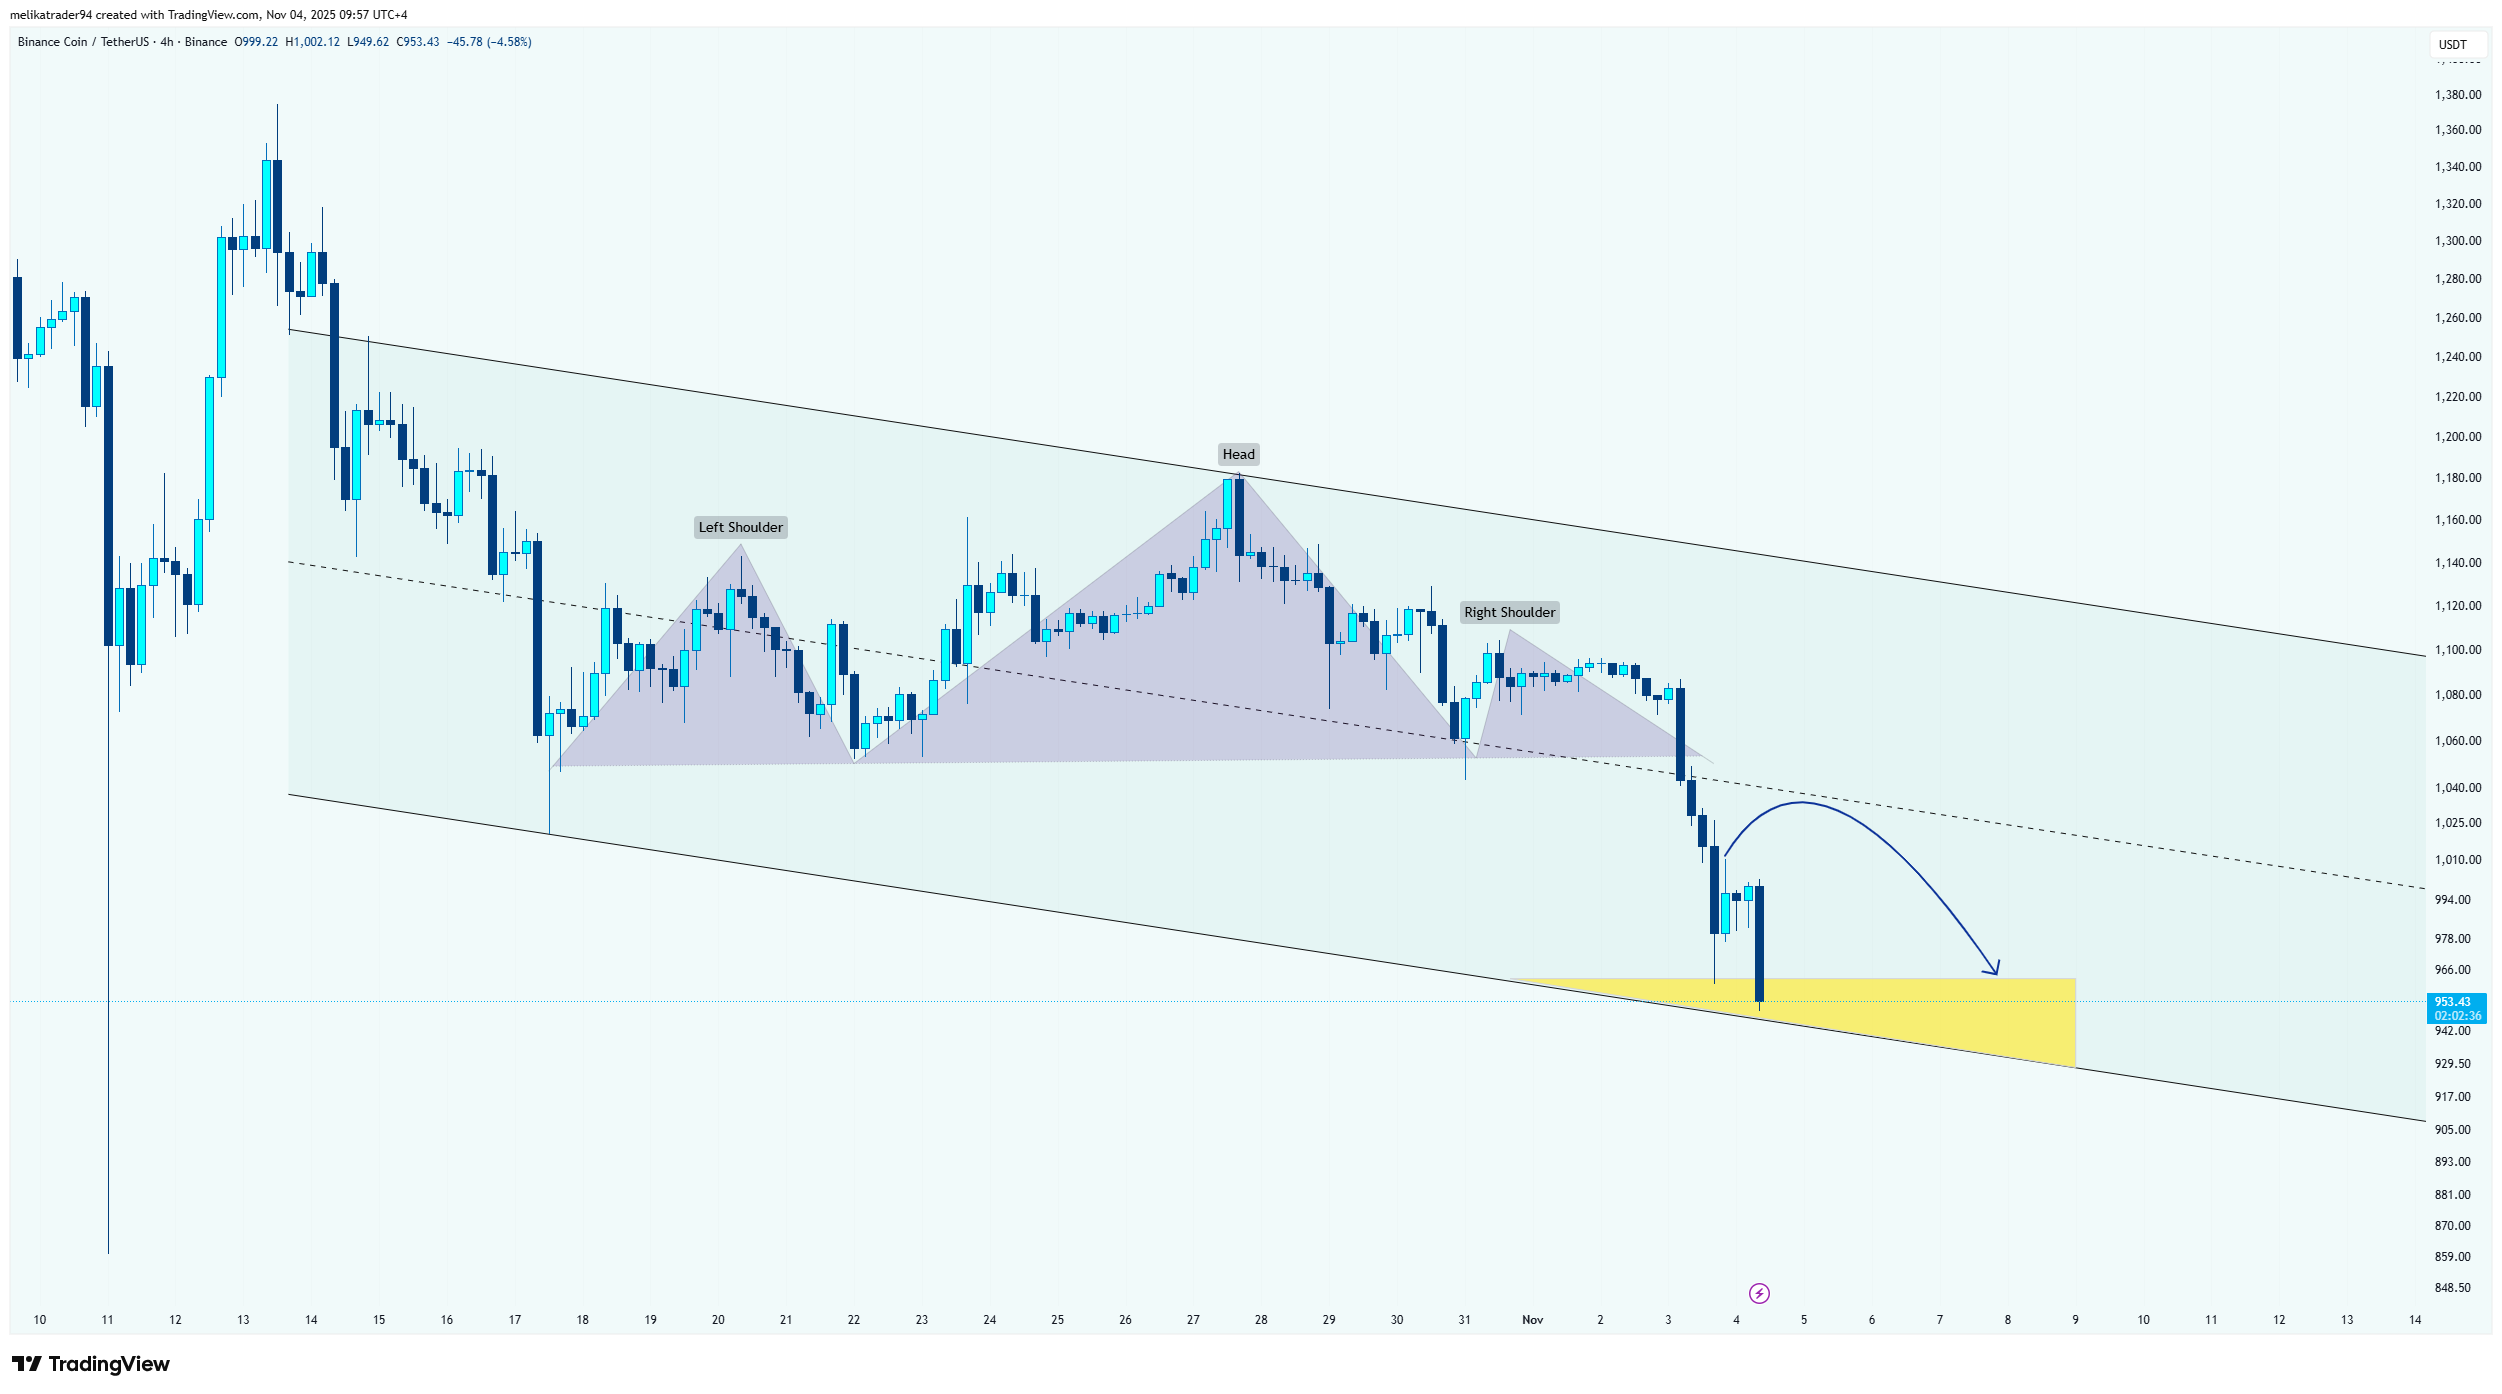
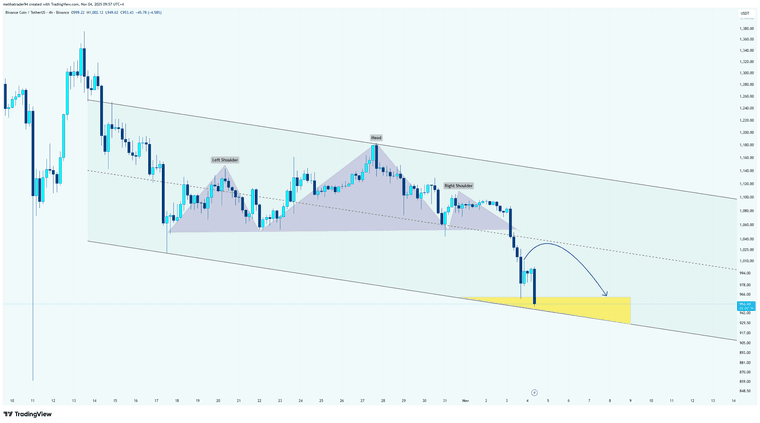
The chart shows a descending channel, indicating that the broader trend remains bearish. Inside this channel, we can see a Head and Shoulders pattern that recently broke below its neckline, confirming a potential continuation of the downtrend.
After the neckline breakout, price pulled back slightly but continues to trade under the broken support. The two projected blue curves suggest a possible short-term retracement toward the neckline or mid-range of the channel, followed by another move to the downside.
The yellow highlighted area marks a strong target/support zone between roughly $950–$970, which aligns with:
The bottom boundary of the descending channel, and
The measured move projection from the Head and Shoulders pattern.As long as the price stays below the neckline and within the channel, the bearish bias remains intact. A clean break above the neckline could temporarily invalidate this scenario and lead to a relief rally, but overall, momentum favors a continuation toward the lower support zone.
-
BNB looks heavy here; neckline break could accelerate the drop.

 ️
️