


XRPUSDT
-
Hello Traders!
What are your thoughts on RIPPLE ?
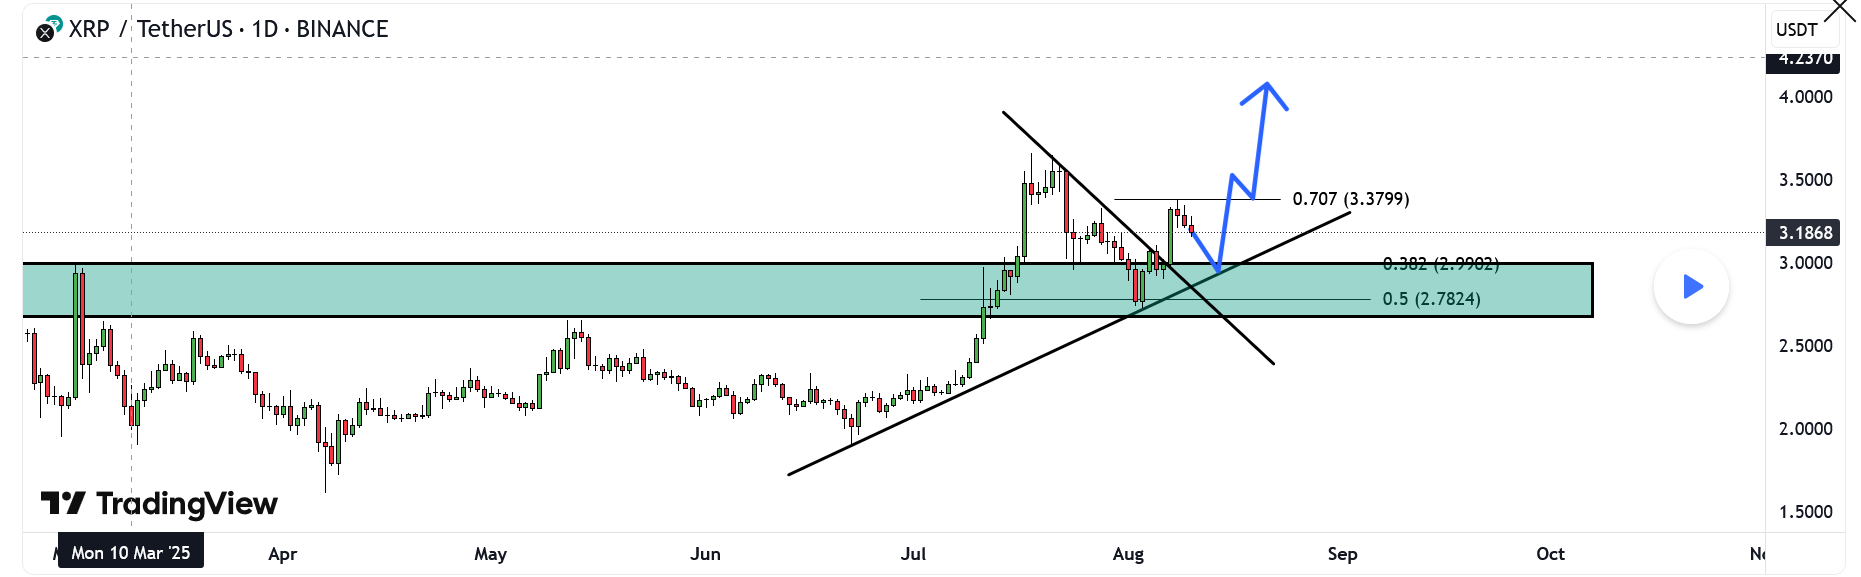
On the XRP chart, we can see that after breaking the descending trendline and reaching a resistance level, the price has entered a corrective phase.
We expect this correction to continue down toward the support zone, which coincides with the ascending trendline. This area also represents a pullback to the previously broken bearish trendline.
Once the pullback is complete, we anticipate a bullish continuation toward higher targets.Don’t forget to like and share your thoughts in the comments!
 ️
️ -
Nice chart breakdown! The confluence of the ascending trendline + support zone + pullback to the broken bearish trendline makes for a really clean technical setup. If XRP can hold that zone and show a strong bounce, the next bullish leg could have solid momentum.
I’m watching volume closely during this correction — low sell volume on the pullback would be a strong sign that buyers are still in control. A break above the rece -
I like how you’ve identified both the correction phase and the potential bullish continuation point. That support area aligning with the ascending trendline is key — if XRP respects it, we could see a strong move toward higher targets, especially if the broader market stays bullish.That said, I’ll also be looking at RSI and MACD around that zone to catch early reversal signals. If momentum indicators align with the support bounce, it could be a great entry point for the next wave up.