Skip to content
  • Categories
  • Recent
  • Tags
  • Popular
  • World
  • Users
  • Groups
Collapse
Brand Logo
UDS UDS: $2.5284
24h: 0.17%
Trade UDS
Gate.io
Gate.io
UDS / USDT
MEXC
MEXC
UDS / USDT
WEEX
WEEX
UDS / USDT
COINSTORE
COINSTORE
UDS / USDT
Biconomy.com
Biconomy.com
UDS / USDT
BingX
BingX
UDS / USDT
XT.COM
XT.COM
UDS / USDT
Uniswap v3
Uniswap v3
UDS / USDT
PancakeSwap v3
PancakeSwap v3
UDS / USDT

Earn up to 50 UDS per post

Post in Forum to earn rewards!

Learn more
UDS Right

Spin your Wheel of Fortune!

Earn or purchase spins to test your luck. Spin the Wheel of Fortune and win amazing prizes!

Spin now
Wheel of Fortune
selector
wheel
Spin

Paired Staking

Stake $UDS
APR icon Earn up to 50% APR
NFT icon Boost earnings with NFTs
Earn icon Play, HODL & earn more
Stake $UDS
Stake $UDS
UDS Left

Buy UDS!

Buy UDS with popular exchanges! Make purchases and claim rewards!

Buy UDS
UDS Right

Post in Forum to earn rewards!

UDS Rewards
  1. Home
  2. Trading
  3. BTC - Liquidity Dynamics leading to new Highs

BTC - Liquidity Dynamics leading to new Highs

Scheduled Pinned Locked Moved Trading
3 Posts 3 Posters 3 Views
  • Oldest to Newest
  • Newest to Oldest
  • Most Votes
Reply
  • Reply as topic
This topic has been deleted. Only users with topic management privileges can see it.
  • AIcashA Offline
    AIcashA Offline
    AIcash
    wrote last edited by
    #1

    32ad329f-9c98-4333-ac67-03ff3e8b794e-image.png Market Context
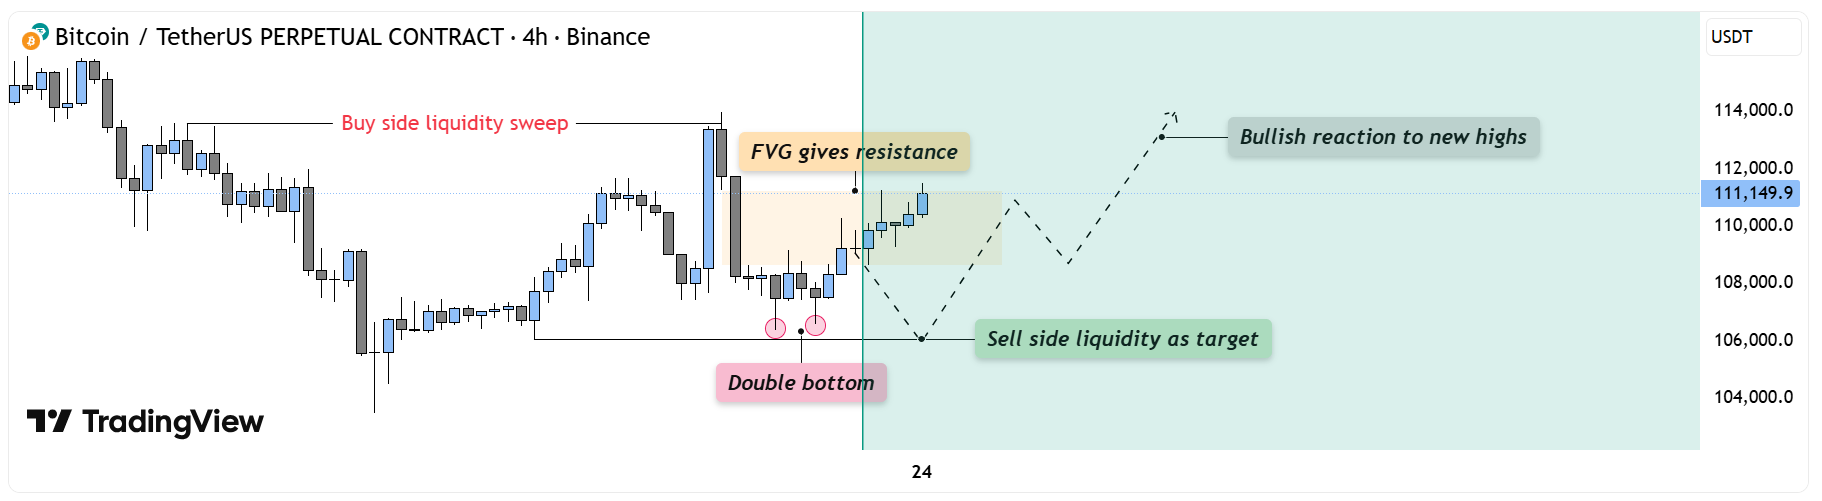
    Bitcoin has shown a constructive reaction from the recent lows, printing a clean double bottom structure that suggests short-term demand entering the market. After a previous buy-side liquidity sweep and rejection, price has rebalanced and is now challenging a fair value gap (FVG) that previously served as resistance. This marks a key decision zone where the next directional move will unfold.

    Fair Value Gaps & Structure
    The FVG overhead has already acted as resistance, capping the first impulsive move from the lows. Should price retrace slightly to take out the remaining sell-side liquidity below the double bottom before re-engaging higher, it would confirm the area as a springboard for a bullish continuation. A clean reclaim and hold above the FVG zone would signal a shift in order flow favoring buyers.

    Liquidity Dynamics
    The current setup offers both sides of the market clear liquidity targets: sell-side liquidity resting under the double bottom and buy-side liquidity resting above the prior high. Smart money could engineer a sweep of the lower side first to accumulate before expansion, or alternatively, break directly through resistance to trigger a larger bullish leg.

    Final Thoughts
    The structure reflects a balanced but bullish-leaning scenario — a classic accumulation and breakout setup. A deeper retest to clear out lower liquidity would strengthen the foundation for continuation, while sustained strength above the FVG opens the door for a reaction toward new highs.

    If this analysis aligned with your view, drop a like — do you think we clear the lows first, or head straight for a bullish breakout?

    1 Reply Last reply
    0
    • Nahid10N Offline
      Nahid10N Offline
      Nahid10
      wrote last edited by
      #2

      BTC liquidity maps hint that smart money may be accumulating before the next breakout leg.

      1 Reply Last reply
      0
      • EmTeamE Offline
        EmTeamE Offline
        EmTeam
        wrote last edited by
        #3

        Fresh capital inflows could compress supply near 110K, paving the way for renewed bullish expansion.

        1 Reply Last reply
        0


        • Login or register to search.
        Powered by NodeBB Contributors
        • First post
          Last post
        0
        • Categories
        • Recent
        • Tags
        • Popular
        • World
        • Users
        • Groups