


Inverse Head & Shoulders on Bitcoin – Breakout or Bull Trap?
-
Right now, Bitcoin(BTCUSDT) is moving within its Heavy Support zone($111,980-$105,820).Over the past couple of days, it tried twice to break this area but couldn’t. One big reason is that recently, there was news that Japan is considering allowing banks to invest in crypto. Also, yesterday, Trump confirmed he’ll meet with China’s president on October 31st, which the market took as a positive sign that US-China tensions might ease. Previously, the market dropped on news of potential tariffs, and now it’s reacting to the possible easing of those tensions.
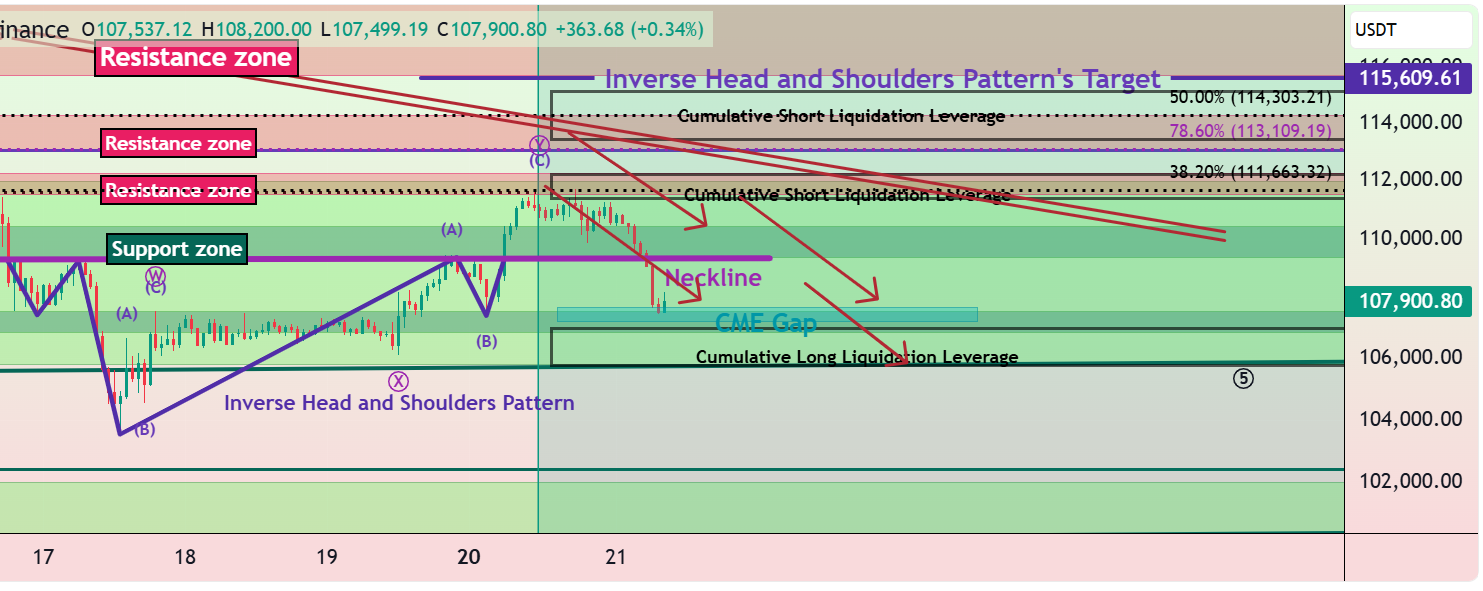
In the last 24-48 hours, Bitcoin has formed an inverse head and shoulders pattern, which could signal a short-term bullish reversal. However, there are still important resistance levels and cumulative short liquidation areas overhead. We need to see if Bitcoin can break through those.
From an Elliott Wave perspective, Bitcoin still seems to be in a corrective structure, and until it gets above around $116,000, there’s still a risk of further downside. So we shouldn’t get too excited about the recent 48-hour bounce.
In short, I expect Bitcoin might push up to those Resistance lines, the Resistance zone($114,300-$113,000), and Cumulative Short Liquidation($115,241-$113,454), thanks to the inverse head and shoulders, but it could face resistance there and possibly drop again.
Note: It seems that we may see an increase in Bitcoin with the opening of the US market, but because the SPX500 index(SPX) is in a correction situation, we can expect Bitcoin to fall again.
-
Strong breakout volume will decide if this move is a real trend shift or another bull trap.