


EUR/USD (Euro vs U.S. Dollar)
-
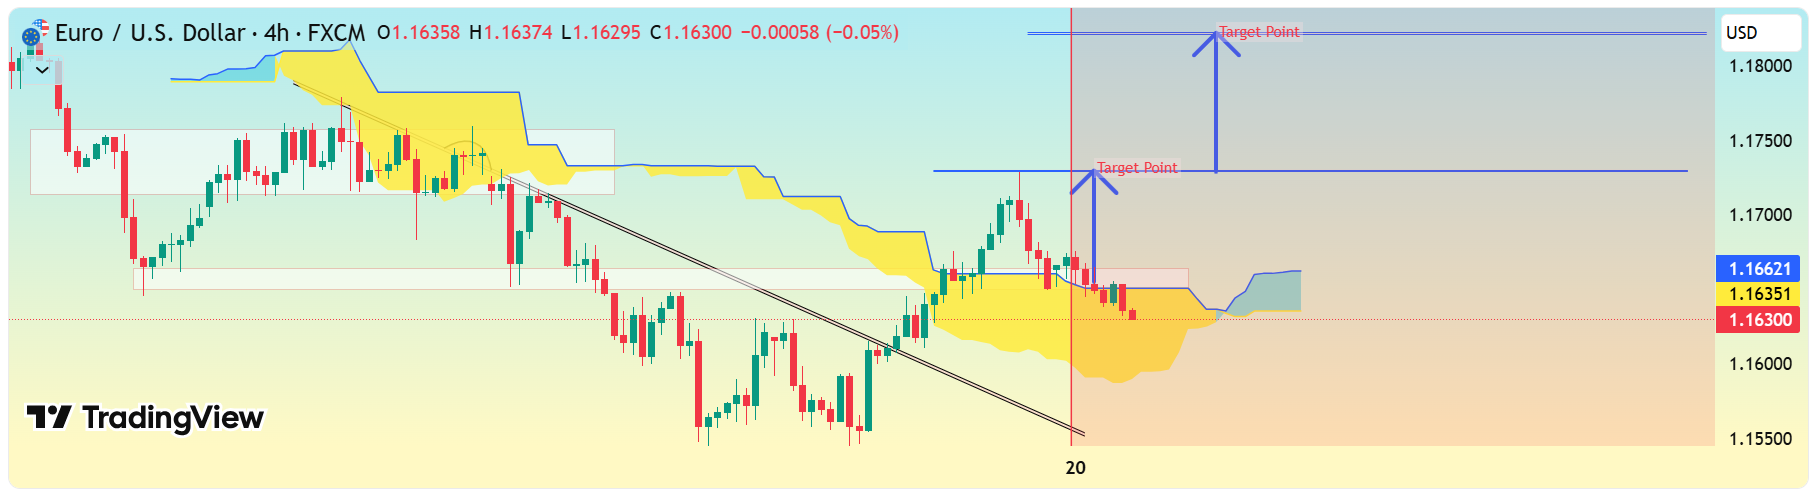 EUR/USD (Euro vs U.S. Dollar) chart Pattern this is a 4-hour timeframe Ichimoku Cloud, and my marked two target levels labeled “Target Point.”
Here’s the breakdown:
Current price: around 1.1660 – 1.1670
Structure: price has broken above a descending trendline and is holding above the Ichimoku cloud, suggesting a bullish continuation.
My chart shows two upward projection levels (target zones).
 Target Levels (as marked on my chart)
-
First Target Point: ≈ 1.1740 – 1.1750
→ This corresponds to the first measured breakout target — a moderate move above the current resistance. -
Second / Final Target Point: ≈ 1.1800 – 1.1820
→ This is the extended target from the larger breakout structure, aligning with prior highs and resistance on the left side of the chart.
 Summary
Element Level (Approx.)
Current Price 1.1660
Target 1 1.1740 – 1.1750
Target 2 1.1800 – 1.1820
Support / Stop-Loss (suggested) Below 1.1630 (below the cloud base)This setup indicates a bullish bias as long as price remains above 1.1630, aiming first for 1.1750, and then 1.1820 if momentum continues.
-