


AMAZON (AMZN) - H4 - Double Top Breakdown (19.10.2025)
-
 Setup Overview:
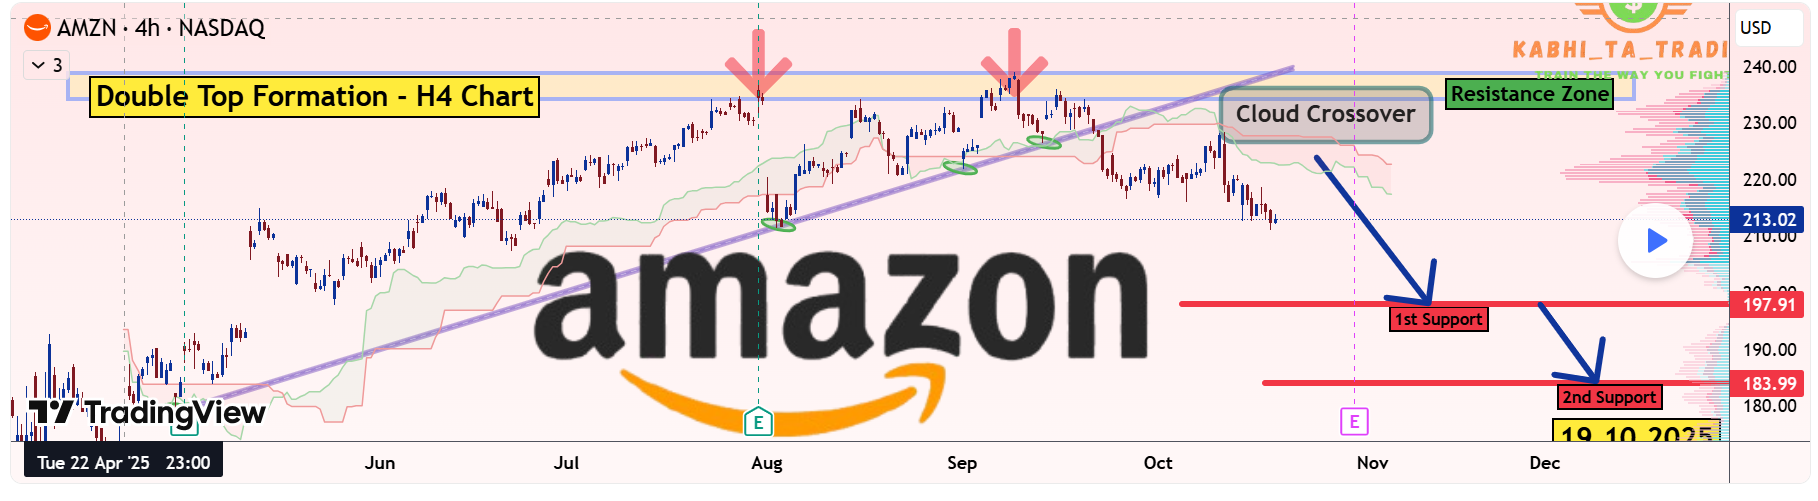
Amazon stock (NASDAQ: AMZN) is forming a Double Top Reversal Pattern on the 4H chart, signaling potential weakness after failing twice to break above the major resistance zone near $238–$240.The price has also broken below the ascending trendline with a cloud crossover, confirming bearish momentum building up.
AMZN Trade Plan:
Bias: Bearish below $220
1st Target: $197.91
2nd Target: $183.99
Resistance Zone: $238 – $240🧩 Technical Confluence:
1.Double Top formation near major resistance zone
2.Trendline break confirming reversal
3.Ichimoku Cloud crossover indicating bearish momentum
4.Volume profile shows selling pressure increasing below $215 Fundamental Amazon (AMZN):
Amazon remains one of the most dominant global tech giants, but several near-term factors could impact its price action: Upcoming Earnings (Late October 2025):
1.Analysts project Q3 FY2025 revenue around $158–160 billion, with EPS expectations near $1.24–$1.30.
2.Focus will be on AWS (Amazon Web Services) performance — which still contributes over 50% of total operating income, but has shown slower growth due to corporate cost-cutting and cloud competition.
Retail & E-commerce Trends:1.Amazon’s North America segment remains strong but margin pressure continues due to logistics and rising fulfillment costs.
2.The company’s push into AI-driven retail advertising could offset some of that weakness if ad revenue exceeds expectations.
Broader Market Context:1.With U.S. yields staying elevated, large-cap tech stocks like Amazon may face valuation compression.
2.Institutional rotation toward value and defensive stocks could further weigh on AMZN in the short term.
Overall, fundamentals remain strong for the long-term, but the technical structure suggests a near-term correction before accumulation resumes.