


BTCUSDT: Structure Suggests Possible Recovery Toward 68.8K
-
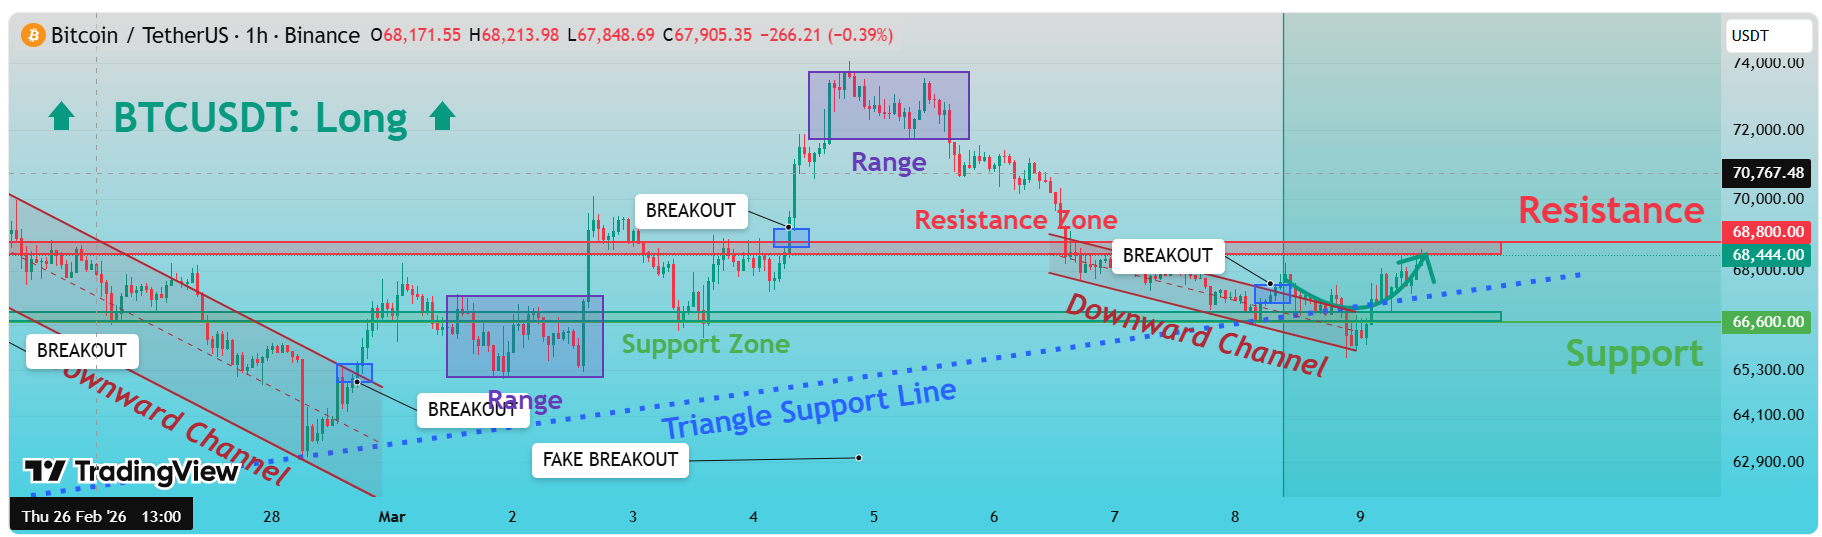
Hello everyone, here is my breakdown of the current BTCUSDT setup.Market Analysis
BTCUSDT previously moved inside a clearly defined downward channel, where sellers remained in control and price consistently formed lower highs and lower lows. This bearish structure reflected steady selling pressure as the market respected both the upper resistance boundary and the lower support of the channel. During this phase, recovery attempts were repeatedly rejected near the descending resistance line, confirming that sellers were actively defending the trend. After the decline reached a lower price region, the market formed a fake breakout below the broader triangle support line, which briefly pushed price lower before buyers stepped in and triggered a strong rebound. This reaction signaled the presence of demand and led to a recovery phase that brought price back above the support line and toward a previously established support zone around 66,600. Eventually, price broke out of this range to the upside, producing a strong bullish impulse that pushed the market toward a higher range formation near the local highs.
Currently, after reaching this upper consolidation area, BTC began to lose momentum and shifted into another corrective phase. The market then formed a new downward channel, where price gradually drifted lower while respecting the descending resistance line. This decline brought BTC back toward the support zone near 66,600, which now aligns with the rising triangle support line, creating a key confluence area where buyers could potentially step in again.
My Scenario & Strategy
As long as BTCUSDT continues to hold above the 66,600 support zone and respects the ascending triangle support line, the broader bias remains bullish. This area represents a strong demand region where buyers previously reacted, and another bounce from this level could trigger a recovery move back toward the 68,800 resistance zone, which also aligns with the former resistance area and the upper boundary of the recent structure. A successful rebound from support could push price out of the current downward channel and initiate a new bullish leg toward the 68,800 resistance level, which represents the primary upside target for this scenario. A confirmed breakout and consolidation above this level would indicate strengthening bullish momentum and could open the path for a broader recovery.
However, if price fails to hold the 66,600 support zone and breaks below both the horizontal support and the triangle trend line, the bullish outlook would weaken. Such a breakdown could trigger further downside continuation and expose lower demand levels. For now, the structure favors long opportunities near support, while the market approaches an important decision zone between demand and the descending channel resistance. As always, wait for confirmation and manage your risk properly.
That’s the setup I’m tracking. Thank you for your attention, and always manage your risk.