


Tether Dominance Hits 8% as Capital Moves to the Sidelines

-
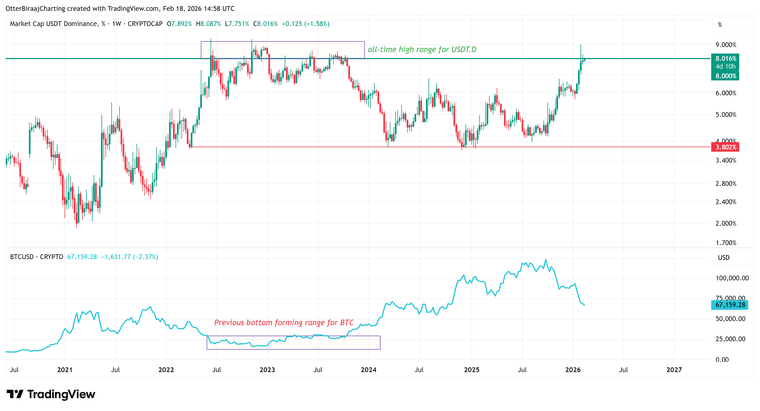
USDT.D and BTC price chart comparison. Source: Cointelegraph/TradingViewStablecoin flows are adding another layer to the market shift. Tether’s USDt (USDT) dominance recently climbed to 8% on the weekly chart — levels last seen between June 2022 and October 2023. Historically, rising stablecoin dominance signals that traders are rotating into dollar-pegged assets rather than deploying capital into volatile cryptocurrencies like Bitcoin or Ether.
Previous declines in USDT dominance — particularly around the 3.8–4% range in March 2024, December 2024, and October 2025 — coincided with Bitcoin reaching new all-time highs near $72,000, $104,000, and $126,000. Analysts suggest that while elevated stablecoin dominance often aligns with consolidation or bear market conditions, a reversal in this metric could be one of the earliest signals of renewed bullish momentum.
-
every time stablecoin dominance rolls over, that’s when things get interesting. until then it’s mostly chop.