


SOLUSD at long-term linear-regression support
-
SOLUSD has had a rough year in 2025 with major drawdowns and new highs as well. Neither bulls nor bears have had a painless path.
Will 2026 be different? A lot depends on the Fed, liquidity, inflation prints, and more.
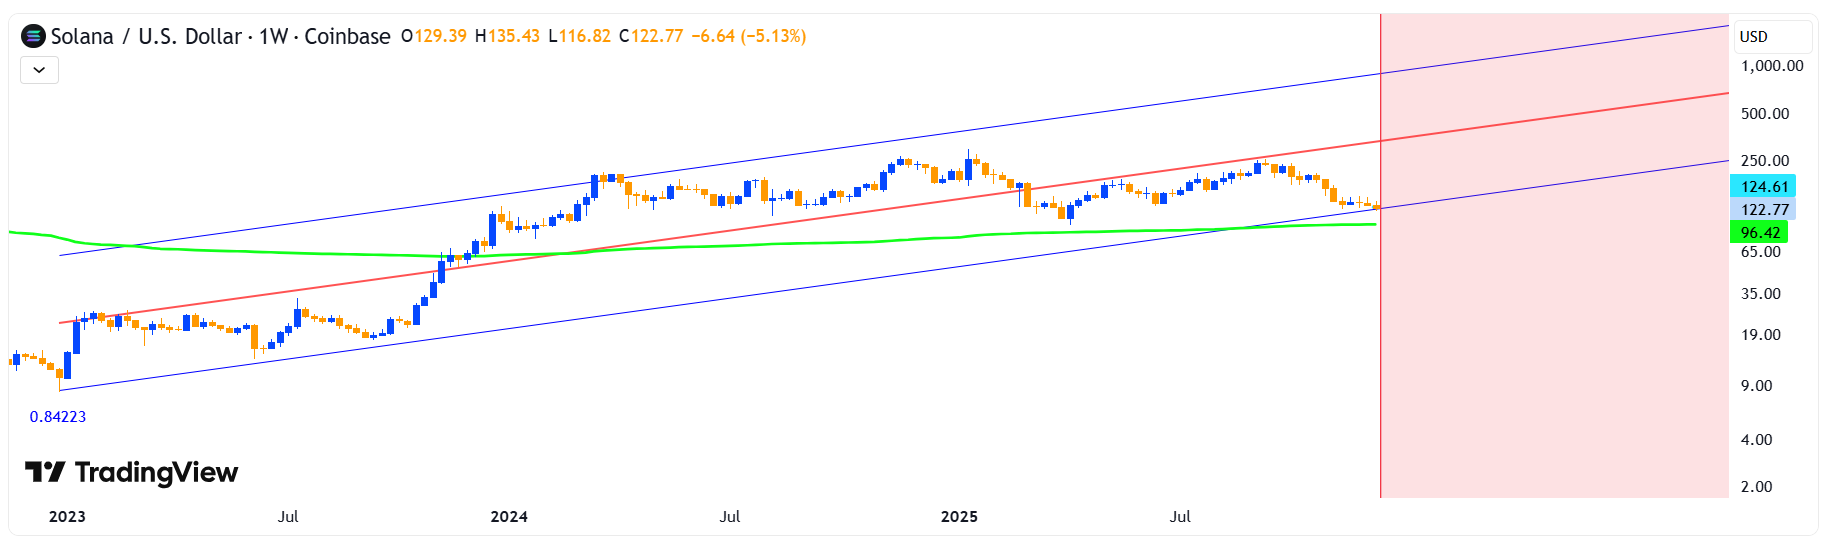
But SOL found a bottom today at the -2 standard deviation line on a log-scale linear regression going back to the all-time low in December 2022. This is a convenient tool developed by Forza that is an open-source script that "slightly modifies TradingView's built-in linear regression script" which allows it to be plotted on log-scale charts. I've thought recently that it may be worth taking a shot at SOL long, with risk limited to the -2 standard deviation line on a log scale chart.
The AVWAP from the inception of the chart (shown weekly above and dates back to June 2021 for this particular exchange's chart), lies around $96-$97.
No certainties exist in trading or investing, and a flush in 1Q would bring further pain to bullish SOL traders and long-term SOL investors. But if SOL continues its bullish path since late 2022, it could reach new all-time highs in 2026-2027. Maybe it's an investment worth considering. As always, do your own research!
-
SOL sitting at long-term support is an interesting spot.