


Yearly Cycle of BTC vs ETH - Long term analysis
-
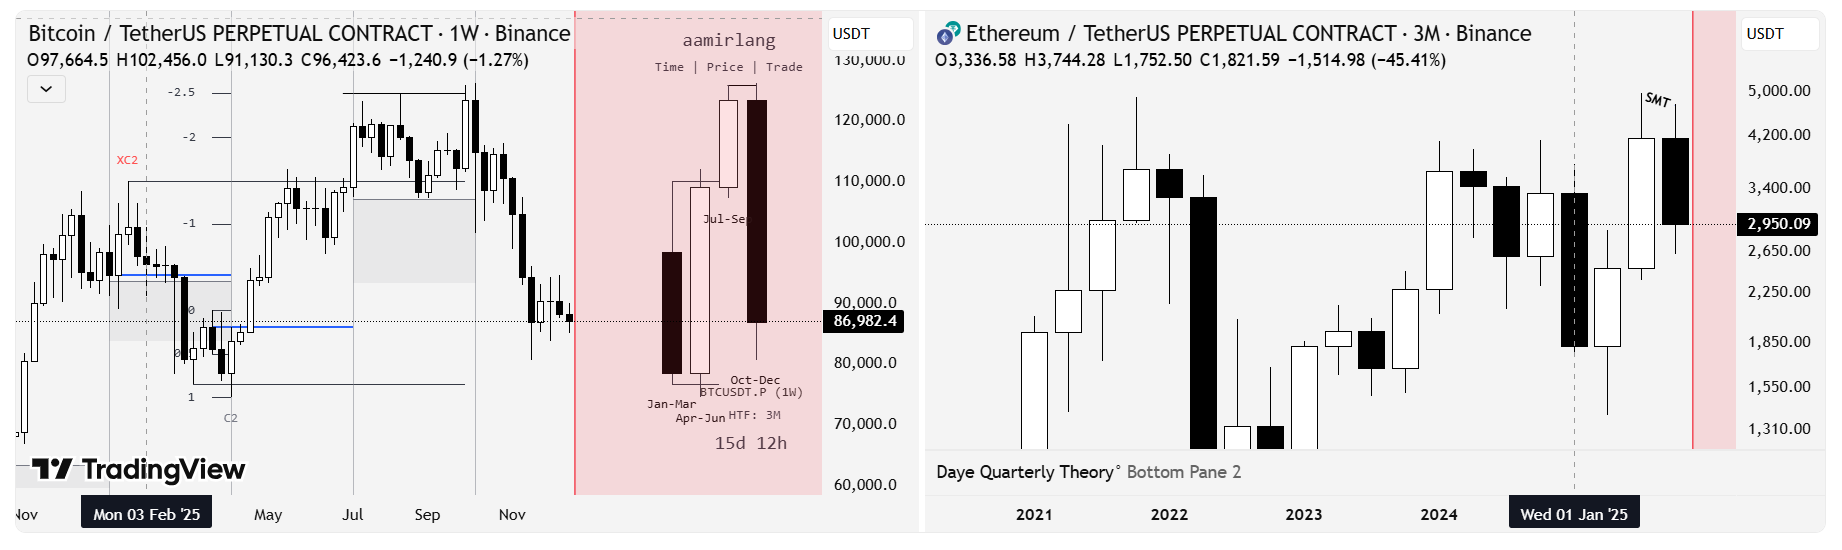
If we look at the Yearly Cycle of BTC and ETH we find that:
BTC:
Q1: Q1 was bearish and droped from $110,000 to $76560 ($33400 drop).
Q2: Q2 swept the low of Q1 and made the Low of the yearly cycle ($74457) and then taking the high of Q1 as well making another ATH @ $11,959,5. This was the most aggressive quarter.
Q3: Q3 was continuation of Q2 and made another ATH $125,877.
Q4: Q4 took the high of Q3 and made ATH $126,208.5 and then dropped making the High of the yearly Cycle. Very beautiful and typical price action.ETH: Eth on the other hand lagged to follow BTC.
Q1: Q1 Dropped to $1535.
Q2: Swept the low of Q1 and made the low of the yearly cycle @ $1384.
Q3: Was very aggressive move and Distribution high making another ATH @ $4957.67.
Q4: Couldnot take the high of Q3 and lagged behind
BTC
and dropped by creating an SSMT.Summarizing the whole year and the year to come:
As we have seen the SSMT (being in formation if we close bearish). We might see the continuation of the downtrend in the next year. We will see and wait if there is another SSMT or any reversal pattern we change our bias bearish to bullish. To me we will find buying oppertunities in the year 2026. -
BTC vs ETH cycles offer valuable long-term positioning insights.