


ASTER - Consolidating at Resistance Zone, Breakout or Fakeout? | Daily Technical Analysis
-
ASTER experienced a significant downtrend from ~$1.40 (October–November 2025) down to a low of ~$0.40 in December 2025. A descending channel trendline was confirmed with multiple rejections at the upper trendline.
Current Consolidation Structure
After a strong bounce from the $0.40 low, price is now in a sideways consolidation phase within the $0.69 - $0.74 range, forming a Rectangle / Ranging Box since mid-February 2026. ️ This is a critical zone - this area previously acted as old support and is now being retested as resistance.
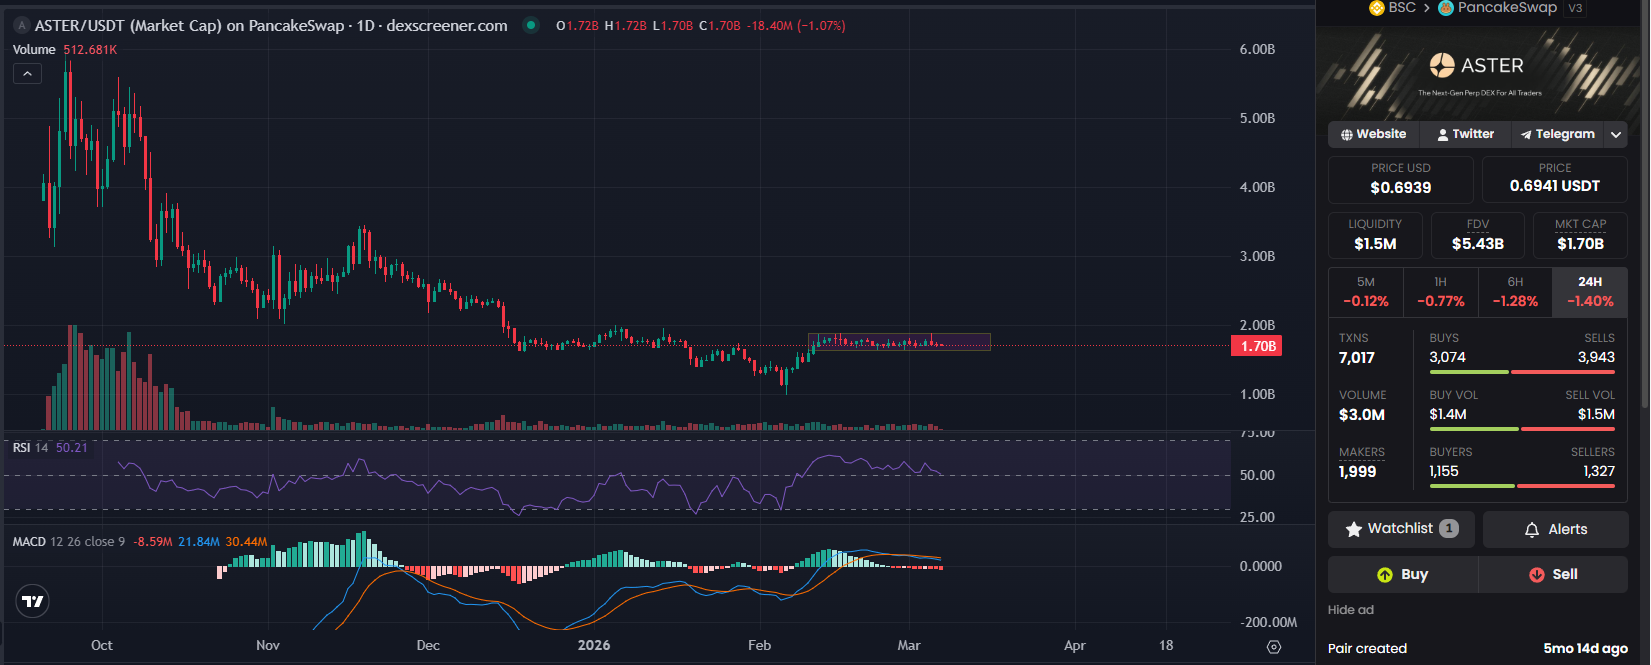
Bullish Scenario (Probability: 40%)
If price successfully breaks out and closes daily above $0.7404:
First target: $0.85
Second target: $0.95–$1.00 (psychological level)
Confirmation: Significant increase in buy volume + RSI breaking above 60Bearish Scenario (Probability: 60%)
If price fails to break out and breaks down below $0.69:First target: $0.58–$0.60
Second target: $0.48–$0.50 (retest of low area)
Confirmation: Dominant sell volume (currently sells 3,938 vs buys 3,061)Conclusion & Strategy
ASTER is currently at a critical crossroads. Consolidating below the $0.74 resistance with sell pressure outweighing buy pressure gives a short-term bearish bias.️ Disclaimer: This is not financial advice. Always do your own research (DYOR) and apply proper risk management. Crypto is highly volatile. -
They are soon out with their main net