


Solana Breaks into an Ascending Triangle – Bullish Continuation
-
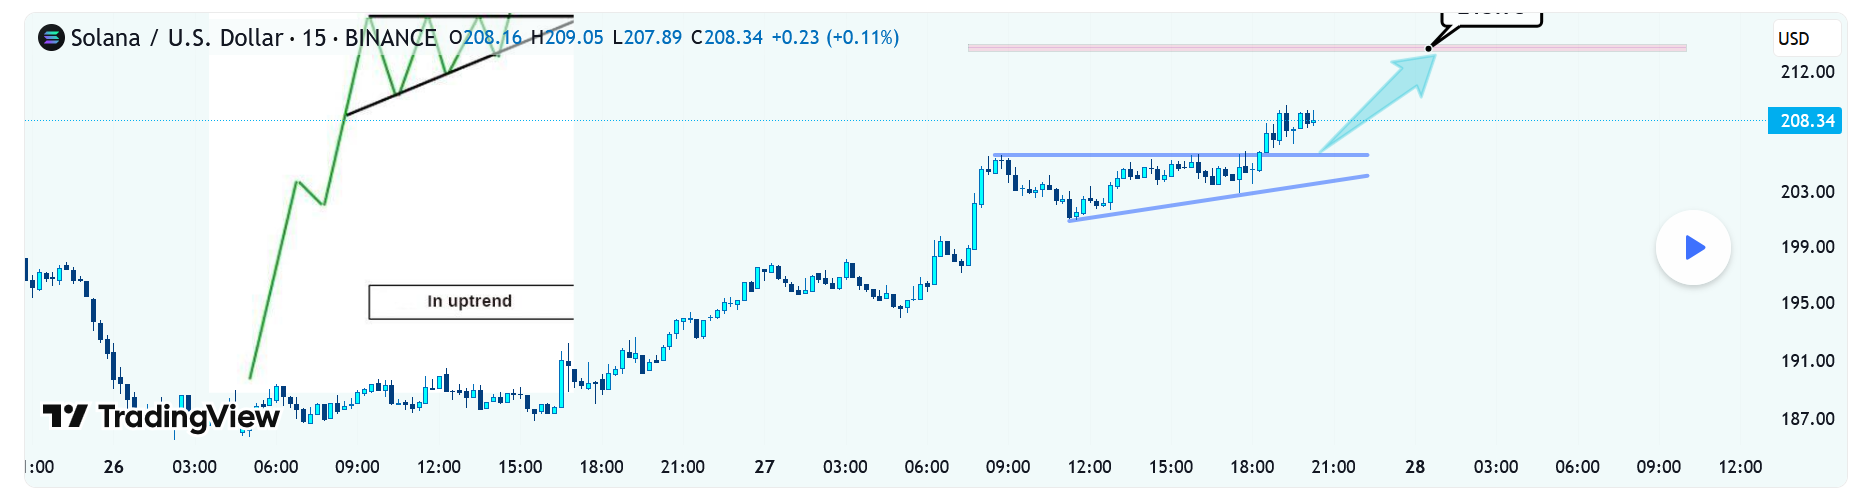
Hello guys!The chart shows Solana (SOL/USDT, 15m timeframe) forming a classic ascending triangle pattern during an ongoing uptrend. The upper resistance level around $206 has been tested multiple times, while the rising trendline from the bottom confirms consistent buying pressure and higher lows.
This setup is a textbook bullish continuation signal, where buyers gradually squeeze sellers against a flat resistance until a breakout occurs. The breakout has already taken place, with SOL pushing above the resistance zone and heading toward the next key target around $213.75, which aligns with the projected move from the triangle’s height.
As long as price holds above the broken resistance (now support), momentum favors further upside. If bulls maintain control, we could see a continuation toward higher resistance zones. However, a drop back below the rising trendline would weaken the setup and signal caution.
most important levels:
Support (retest zone): $206
Immediate target: $213.75
Next potential resistance: above $214
Overall, the breakout from this ascending triangle suggests bullish momentum remains strong for Solana in the short term.
-
Great breakdown! The ascending triangle breakout above $206 looks really clean. As long as that level holds as support, I agree SOL has room to push higher. The $213.75 target lines up perfectly with the measured move, and momentum still favors the bulls.
-
Solid TA! I like how you mapped out the ascending triangle structure. My only caution is if price slips back below $206, the bullish thesis could get weaker. For now, momentum is clearly up, but I’ll be watching closely to see if buyers can defend the retest zone.
