


SUSHI Analysis (4H)
-
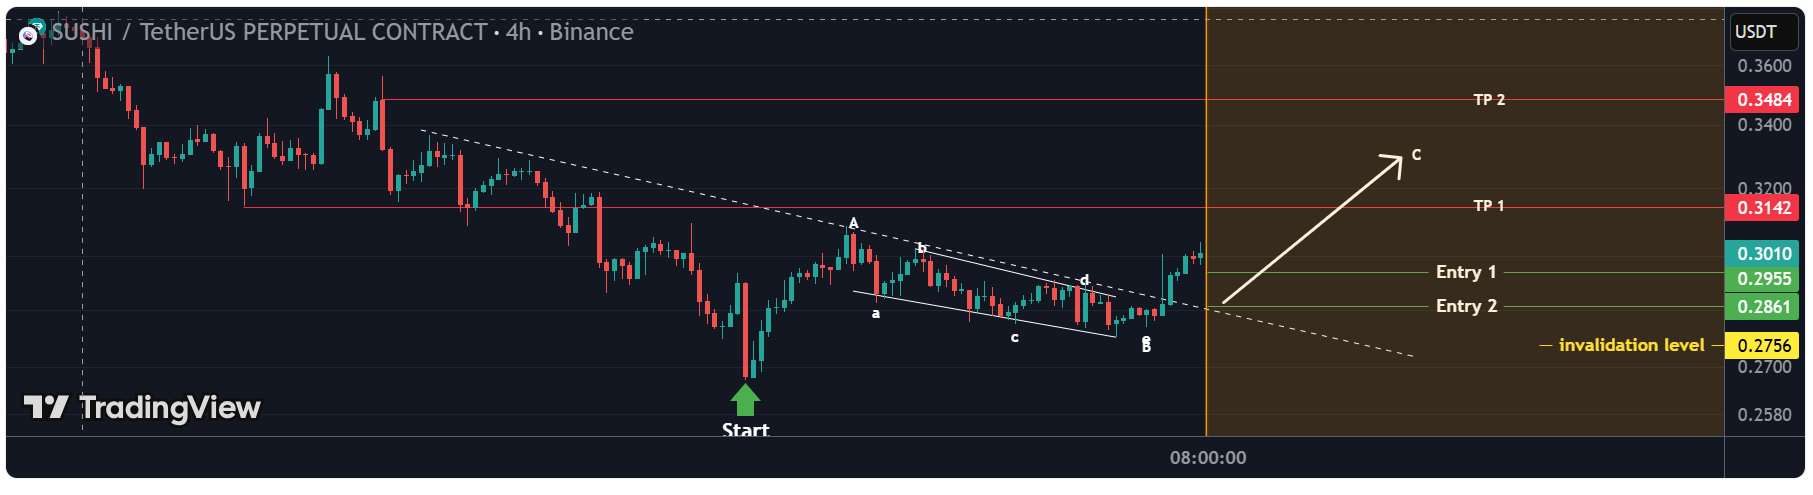
At the lowest price on the chart, if you look closely, a red candle with very strong momentum has formed, but the price quickly reversed. The origin of this candle was a bearish move, which means it was a fake move designed to collect orders.
Since the origin of this candle has been engulfed, we usually see strong moves in the opposite direction of this candle.
Since we placed the green arrow on the chart, a bullish phase with good momentum has started.It seems we have an ABC pattern, or possibly a more complex one, and we are in the early stages of wave C.
Wave C has more room to expand and can continue its upward movement. However, entering a position should be done at optimal points.
We have identified two entry points and will enter using a DCA (Dollar-Cost Averaging) approach.
There are two main targets on the chart, and we suggest closing a portion of the position at the first target.
A daily candle closing below the invalidation level would negate this analysis.
-
SUSHI LETS GOOOO everything in 2026 will be bullish