


USD/JPY - Triangle Breakout
-
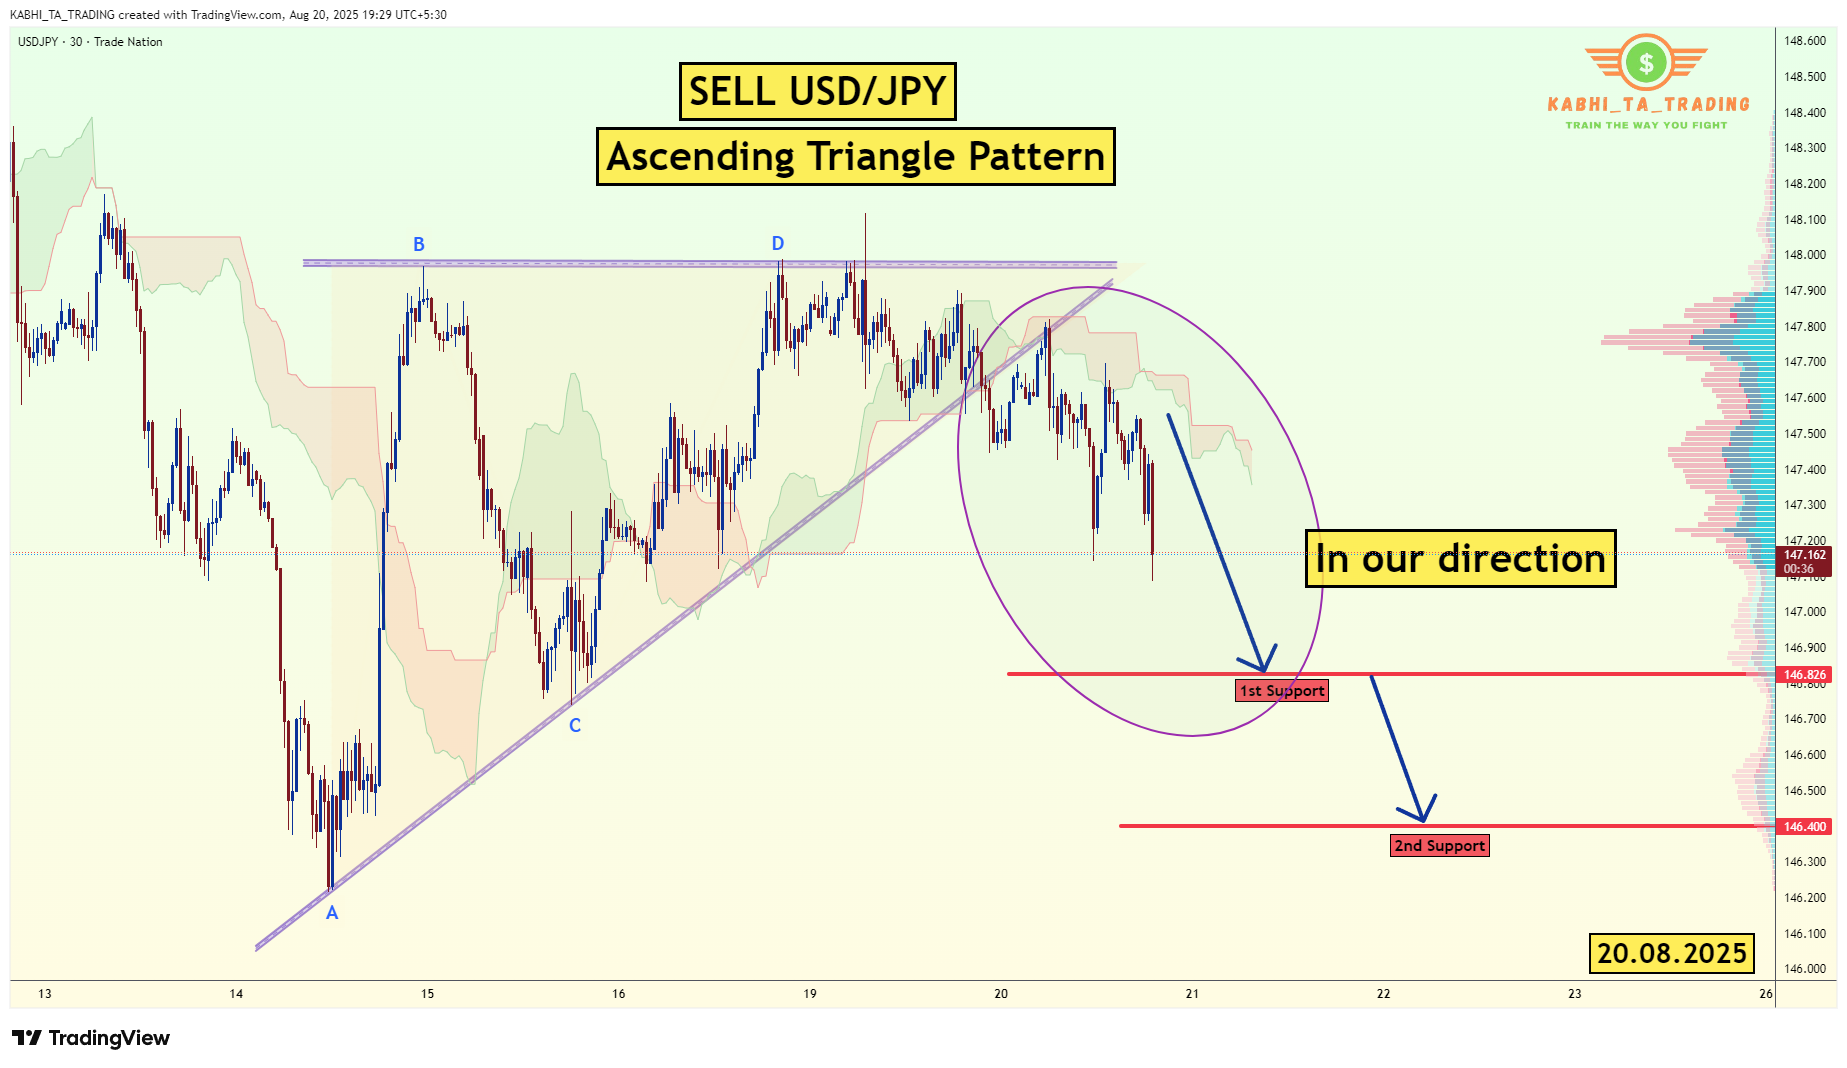
The USD/JPY Pair on the M30 timeframe presents a Potential Selling Opportunity due to a recent Formation of a Ascending Triangle Pattern. This suggests a shift in momentum towards the downside in the coming hours.Possible Short Trade:
Entry: Consider Entering A Short Position around Trendline Of The Pattern.Target Levels:
1st Support – 146.82
2nd Support – 146.40 Please hit the like button and
Leave a comment to support for My Post !Your likes and comments are incredibly motivating and will encourage me to share more analysis with you.
-
Great breakdown on USD/JPY!
 The ascending triangle you pointed out on the M30 looks very convincing, especially since the pair has been struggling to hold momentum above 147.00. A failure to break higher often signals exhaustion from buyers, which lines up with your short idea.
I also like how you mapped the supports — 146.82 and 146.40 both coincide with previous reaction levels on intraday charts. If we see a clean rejection from the trendline, this could easily trigger a wave of sell orders. I’ll definitely be watching for a bearish candle close before pulling the trigger. Keep sharing more of these precise technical insights, they are

-
Really solid analysis!
 The structure of this ascending triangle does look “toppy” on the 30-minute chart, and the fact that USD/JPY has been overextended in recent sessions makes your short setup even more attractive. Your first target at 146.82 lines up with minor liquidity zones, and the deeper target near 146.40 could bring some serious risk-reward if the move plays out.
Personally, I’ll be looking for confirmation from RSI/MACD divergence before entering, but the bias is definitely tilting to the downside here. Posts like this are what keep traders sharp — clear entry ideas, well-defined targets, and disciplined thinking. Thanks for the value you’re adding to the community!
