


ZEC/USDT: Key Reversal Zone & Potential Breakdown
-
 Hi!
Hi!Pattern Structure
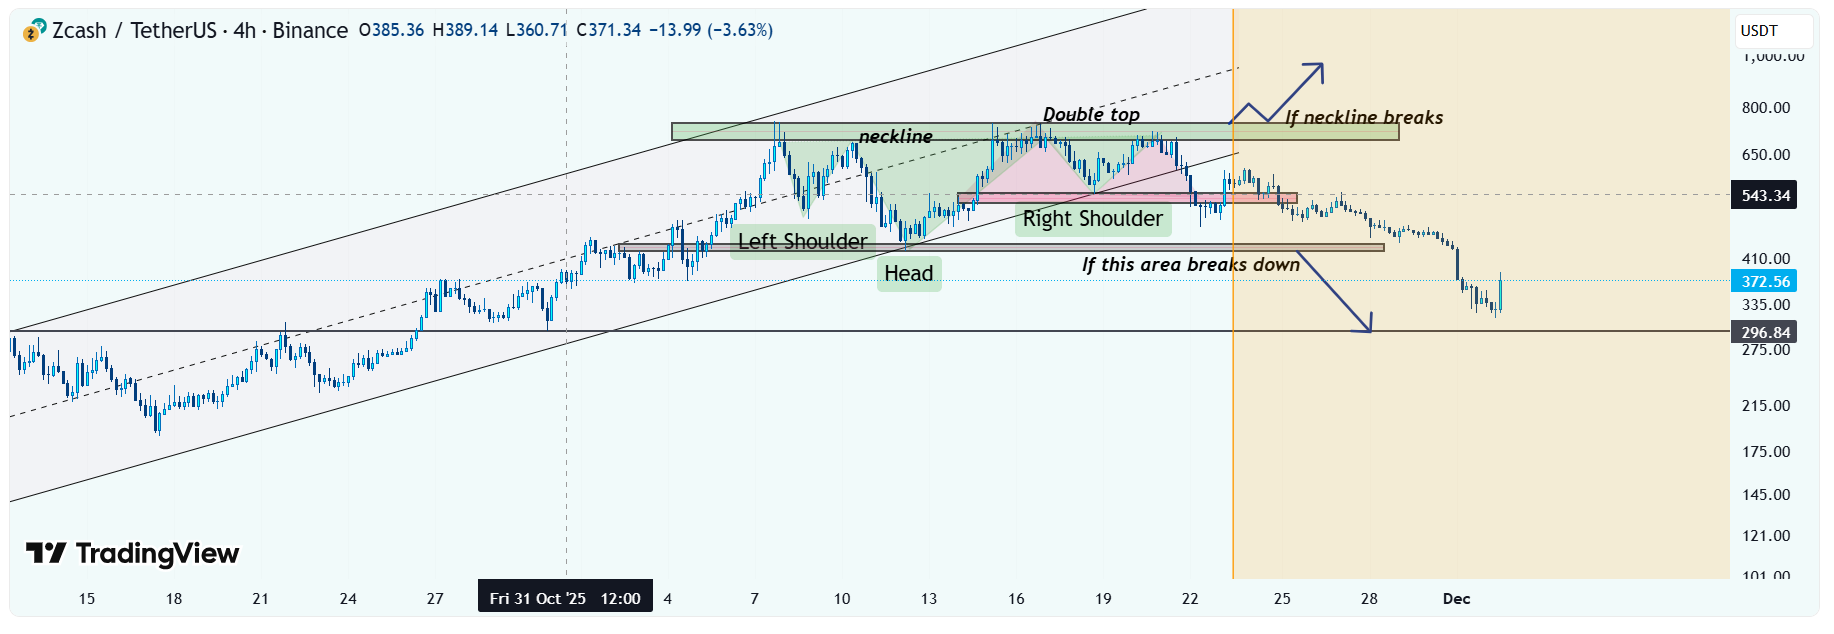
Price has developed a clear inverse Head & Shoulders formation inside a long-term ascending channel.
Neckline sits in the $640–$720 supply zone, which overlaps with a double-top region.Trend Context
Despite being in a broader ascending channel since early November, the right shoulder rejection and break below the minor trendline indicate weakening bullish momentum.Critical Levels
Neckline / Double-Top Resistance: $640–$720
Local Support: $505–$520
Major Support Zone: $440–$460
Final Support: $296–$310 (high-timeframe demand)Bearish Scenario
If the $505–$520 zone breaks decisively, the next downside target becomes the $440–$460 demand zone.
A further breakdown opens the door toward $296–$310, the next major structural support.Bullish Scenario
If buyers reclaim the neckline area ($640–$720) with strong momentum, the pattern invalidates and the move toward $800+ becomes likely.So if the neckline of the inverse head and shoulders breakout, then get long positions!
But if the support zone ($460) breaks down, then focus on shorts! -
ZEC is entering a critical zone — a clean rejection here can trigger deeper downside.