


SOLUSDT Holds Support – Eyes on 148–150 Zone
-
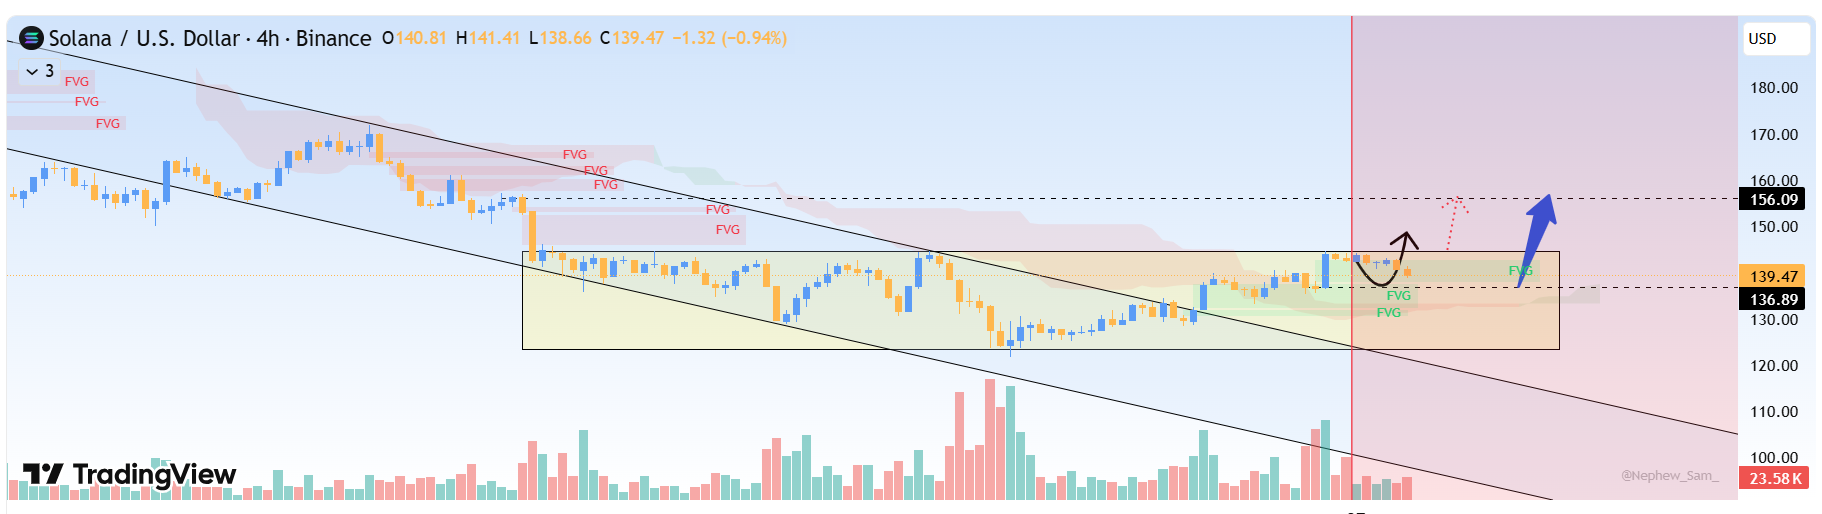 Looking at the H4 chart, SOL has just broken above the green FVG cluster at 136–140 and is now holding above it, turning this area into new support. Multiple H4 candles closing above 140 indicate selling pressure below has weakened, and buyers are accepting higher prices.
The lower Ichimoku cloud is starting to curve up, signaling that the previous downward momentum has lost strength, and a corrective upswing is forming. Above, the large FVG cluster around 148–150 remains untested, likely acting as a “price magnet” for the current move.
My only forecast for SOLUSDT: I expect SOL to continue rising. In the short term, price may pull back slightly to 140–138 to retest the green FVG and attract more buying. As long as SOL holds above 136, these dips are just pullbacks within the uptrend.
From the current base, SOL could gradually climb toward 148–150 USDT, where strong FVG and resistance are located, making it an area to watch in the coming sessions.
-
148–150 is a key demand zone—holding above it keeps SOL in a bullish structure.
-
Break below this range would shift momentum, but buyers still defending well.