


DLF Forms Bullish 'W' Pattern | Strategy Levels Marked
-
 5
5
 STRATEGY SNAP: CLASSIC 'W' BOTTOM PATTERN IN ACTION
CHART SETUP:
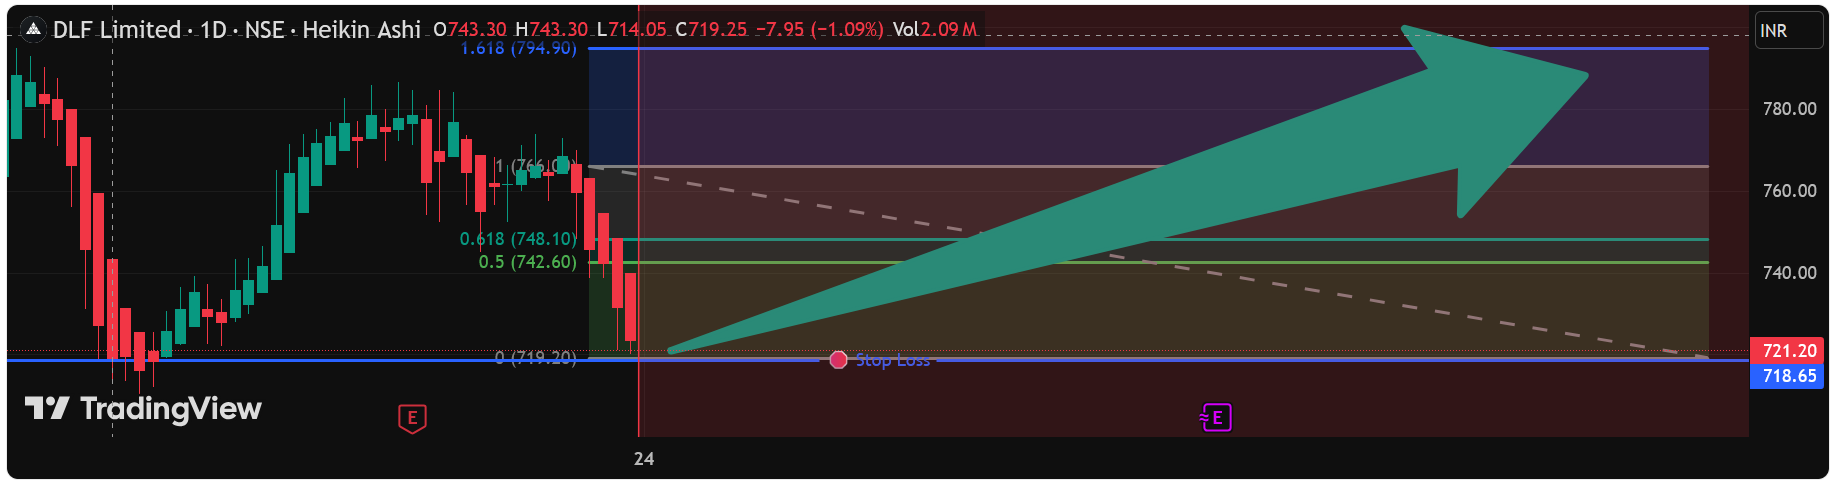
Stock: DLF (India)
Timeframe: Daily - Ideal for swing identification
Pattern: Bullish 'W' Formation (Double Bottom)
Key Feature: Right-side breakout above neckline
 STRATEGY EXECUTION PLAN:
ENTRY ZONE: ₹723 - ₹725
Optimal area for position initiation
Confirmation above pattern neckline
RISK MANAGEMENT:
Stop Loss: ₹715 (Below pattern support)
Risk Per Trade: ~1.4% from entry
Position Sizing: Standard 1-2% portfolio risk
PROFIT TARGETS:
Target 1: ₹740 (+2.1% return)
Target 2: ₹760 (+4.8% return)
Risk-Reward Ratio: 1:2.1 (Very favorable)
 PATTERN EDUCATION - THE 'W' BOTTOM:
Why This Pattern Works:
Double Support Confirmation: Price tested ₹715 level twice and held
Neckline Break: Signal triggers above the W's peak
Volume Confirmation: Ideally should see increasing volume on breakout
Measured Move Projection: Pattern height suggests ₹760 target
Pattern Psychology:
First bottom: Sellers exhaust at support
Middle peak: Bulls attempt recovery
Second bottom: Final test of support confirms reversal
Breakout: Bulls take control above resistance
 MY STRATEGY CRITERIA MET:
 Clear chart pattern identified
Defined entry with confirmation
Specific risk management levels
Favorable risk-reward ratio
Logical target projectionsTRADE MANAGEMENT SUGGESTIONS:
Consider partial profit booking at Target 1
Trail stop loss to breakeven at Target 1
Let remaining position ride to Target 2
 FOLLOW FOR MORE CHART PATTERN STRATEGIES!
 -
A clean W-formation — looks like buyers are stepping back in.

-
A clean W-formation — looks like buyers are stepping back in.
-
If it breaks the neckline, momentum could get strong fast.

-
Timeframe: Daily - Ideal for swing identification