


AMD – Breaking Down or Setting Up a Dead-Cat Bounce? Nov. 21
Trading
4
Posts
3
Posters
5
Views
-
 1-Hour Outlook (Main Bias)
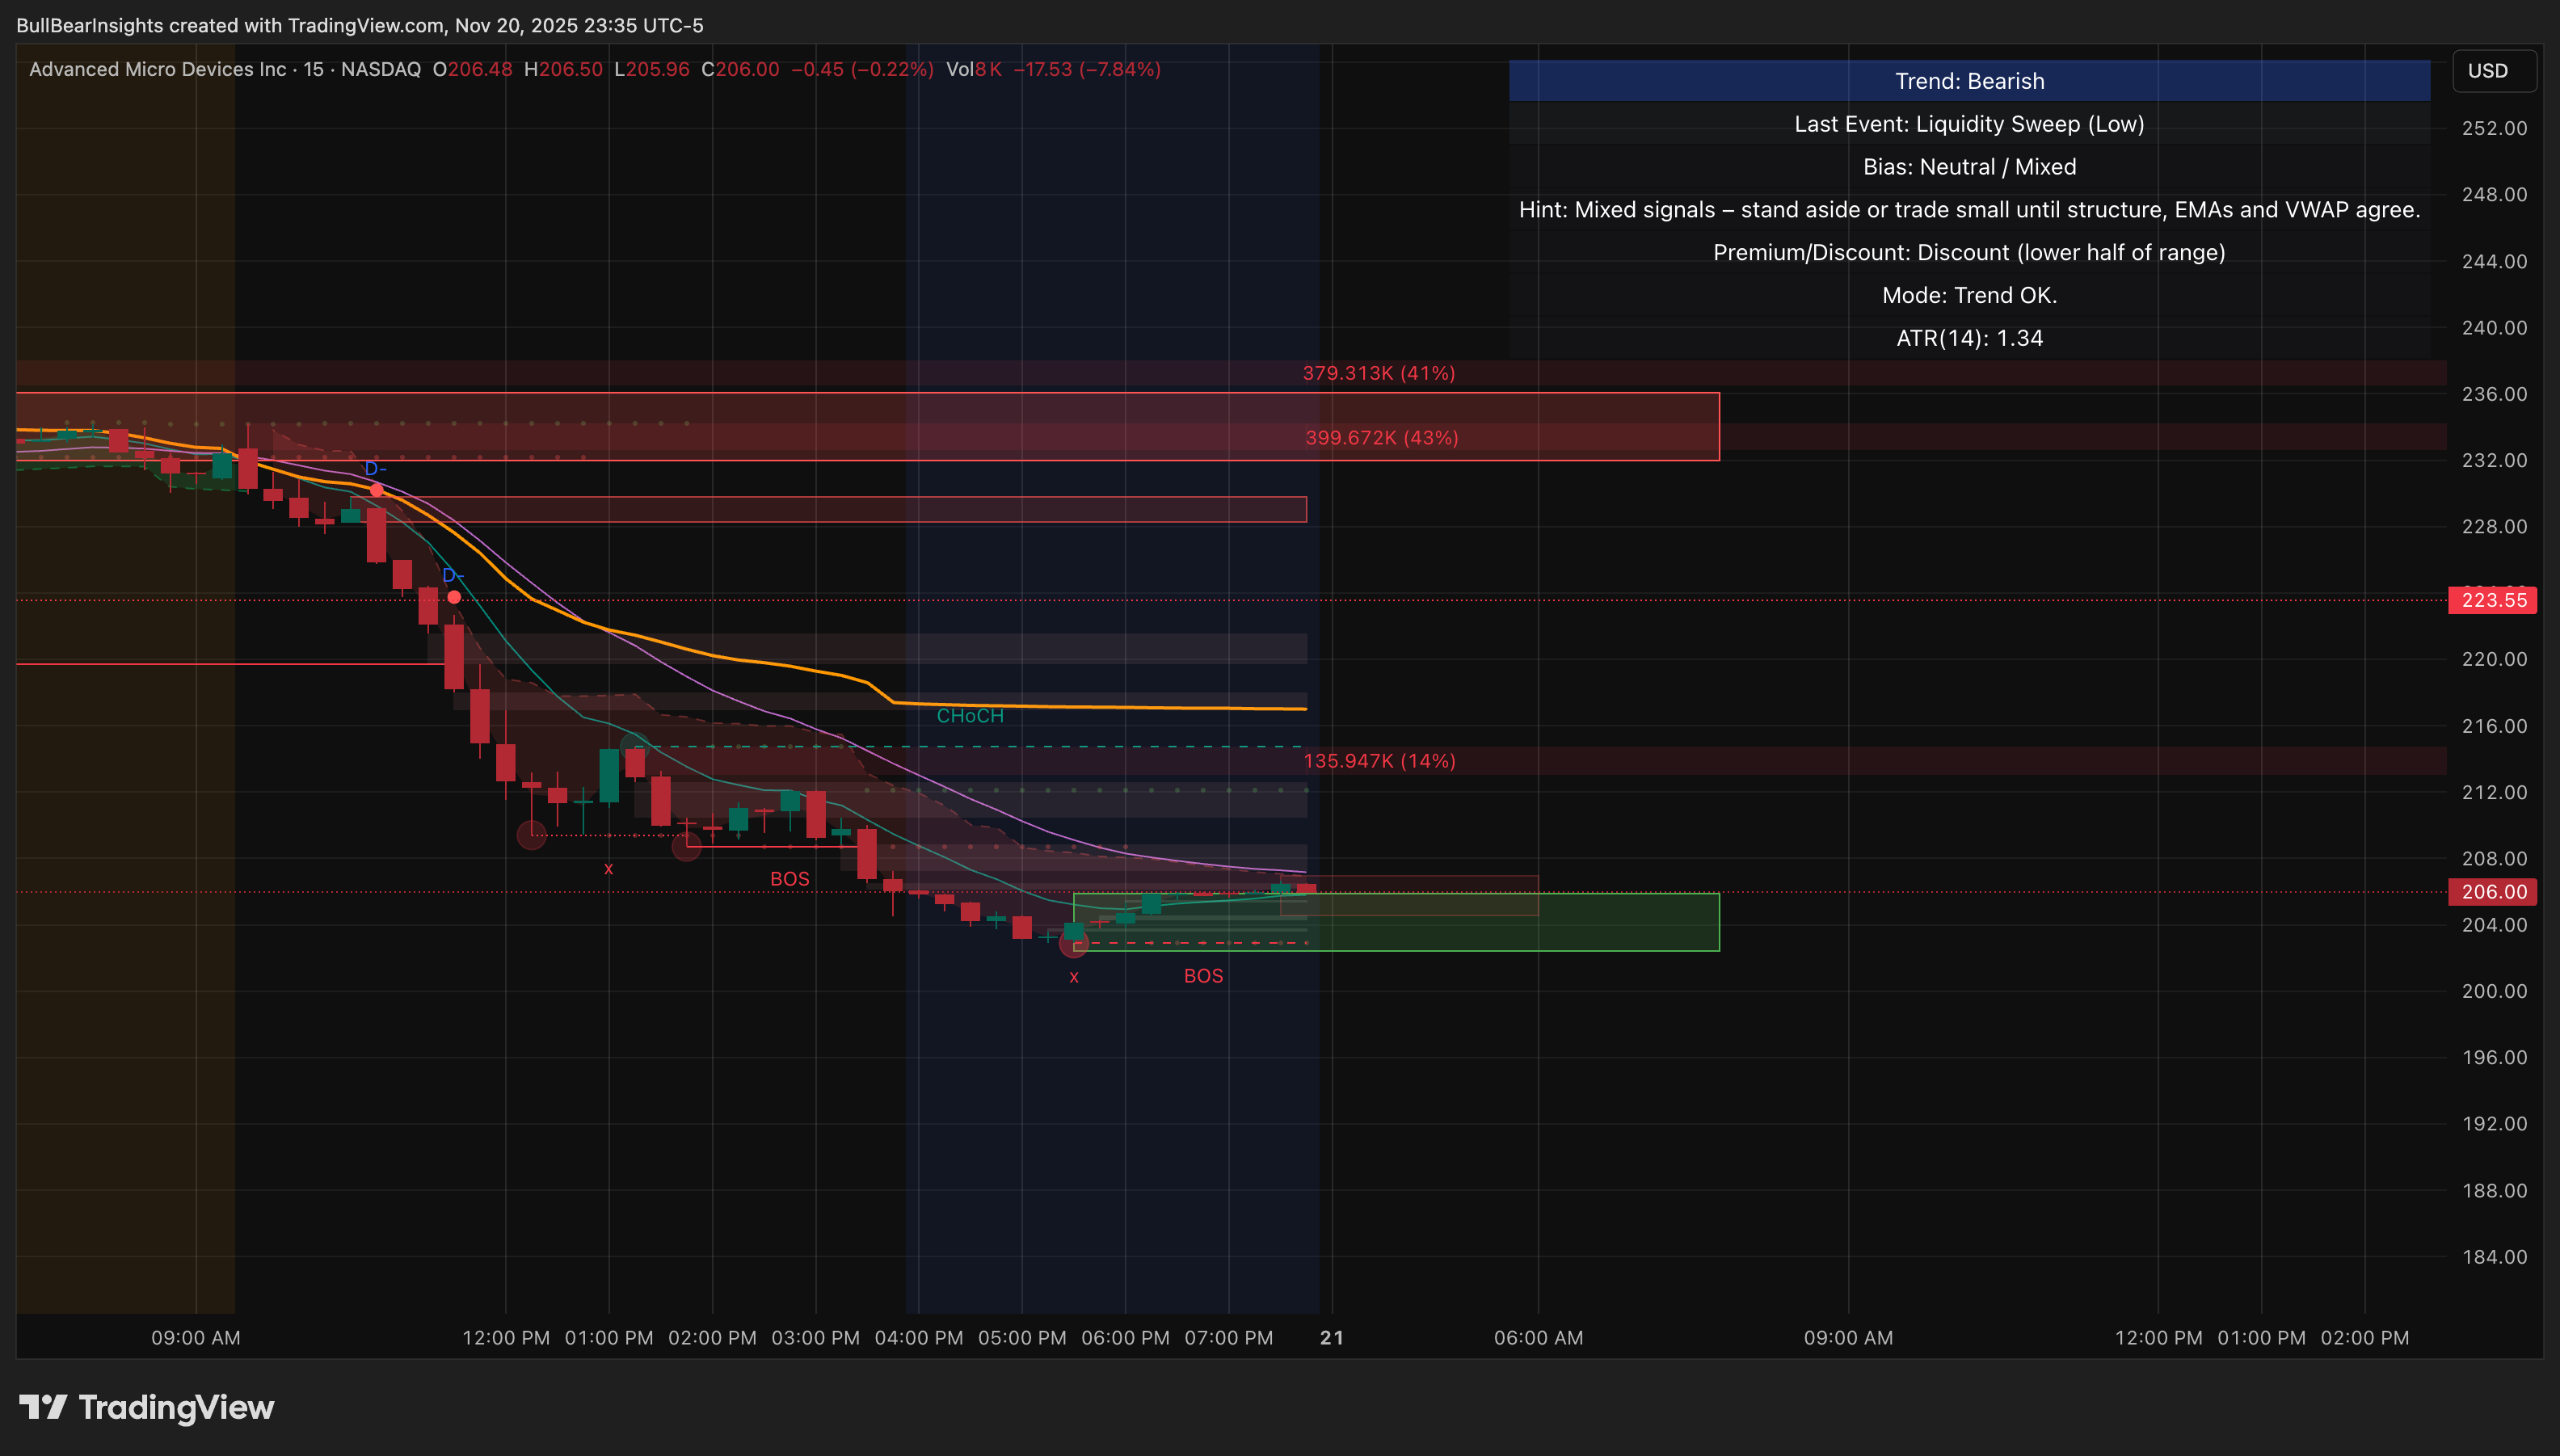
AMD continues its multi-day downtrend and is now sitting near the bottom of the descending channel you marked. The structure is clearly bearish on the 1H, with every bounce getting sold off.
1H Structure- Clean downtrend with lower highs and lower lows.
- Recent drop created another BOS to the downside, confirming continuation.
- Price is now sitting around 205–206, the first minor reaction zone after the liquidity sweep.
- EMAs are stacked bearish, with price trading below all short-term EMAs and below VWAP.
- Momentum (MACD) is still bearish, though slowing — suggesting a potential short-term bounce, not a reversal.
1H Key Levels
Resistance: - 223–225: Major sell zone
- 237: Upper-mid channel resistance
- 263.69: High-timeframe rejection line (unlikely to be tested soon)
Support: - 206: Immediate demand but weak
- 202.5–203: Stronger support from the 1H base
- 200: Psychological and liquidity pool
Bears gain control (continuation): Below 202.50 Bulls gain control (reversal): Only above 223
1H Trading Idea
Bullish (countertrend) bounce setup: Only valid if price holds 205–206 and forms a strong engulfing candle. - Targets: 210 → 213 → 218
- Stop: Below 202.5
Bearish (trend continuation): If AMD rejects anywhere between 210–215, sellers regain momentum quickly. - Targets: 205 → 202.5 → 200
Reversal only becomes real above 223, which is currently far.
15-Minute Outlook (Execution Timeframe)
-
AMD’s price action looks shaky, but these levels often create unexpected bounces.

-
If volume steps in, this could flip quickly — watching closely.

 ️
️ -
Targets: 210 → 213 → 218.
I think It's possible.