Skip to content
  • Categories
  • Recent
  • Tags
  • Popular
  • World
  • Users
  • Groups
Collapse
Brand Logo
UDS UDS: $2.3421
24h: 0.80%
Trade UDS
Gate.io
Gate.io
UDS / USDT
MEXC
MEXC
UDS / USDT
WEEX
WEEX
UDS / USDT
COINSTORE
COINSTORE
UDS / USDT
Biconomy.com
Biconomy.com
UDS / USDT
BingX
BingX
UDS / USDT
XT.COM
XT.COM
UDS / USDT
Uniswap v3
Uniswap v3
UDS / USDT
PancakeSwap v3
PancakeSwap v3
UDS / USDT

Earn up to 50 UDS per post

Post in Forum to earn rewards!

Learn more
UDS Right

Spin your Wheel of Fortune!

Earn or purchase spins to test your luck. Spin the Wheel of Fortune and win amazing prizes!

Spin now
Wheel of Fortune
selector
wheel
Spin

Paired Staking

Stake $UDS
APR icon Earn up to 50% APR
NFT icon Boost earnings with NFTs
Earn icon Play, HODL & earn more
Stake $UDS
Stake $UDS
UDS Left

Buy UDS!

Buy UDS with popular exchanges! Make purchases and claim rewards!

Buy UDS
UDS Right

Post in Forum to earn rewards!

UDS Rewards
  1. Home
  2. Trading
  3. SOL/USDT) Bullish trend analysis Read The caption

SOL/USDT) Bullish trend analysis Read The caption

Scheduled Pinned Locked Moved Trading
3 Posts 3 Posters 16 Views
  • Oldest to Newest
  • Newest to Oldest
  • Most Votes
Reply
  • Reply as topic
This topic has been deleted. Only users with topic management privileges can see it.
  • etfsE Offline
    etfsE Offline
    etfs
    wrote last edited by
    #1

    SMC Trading point update
    1f581e55-92d9-4e13-b28d-9dc7cd8745dd-image.png

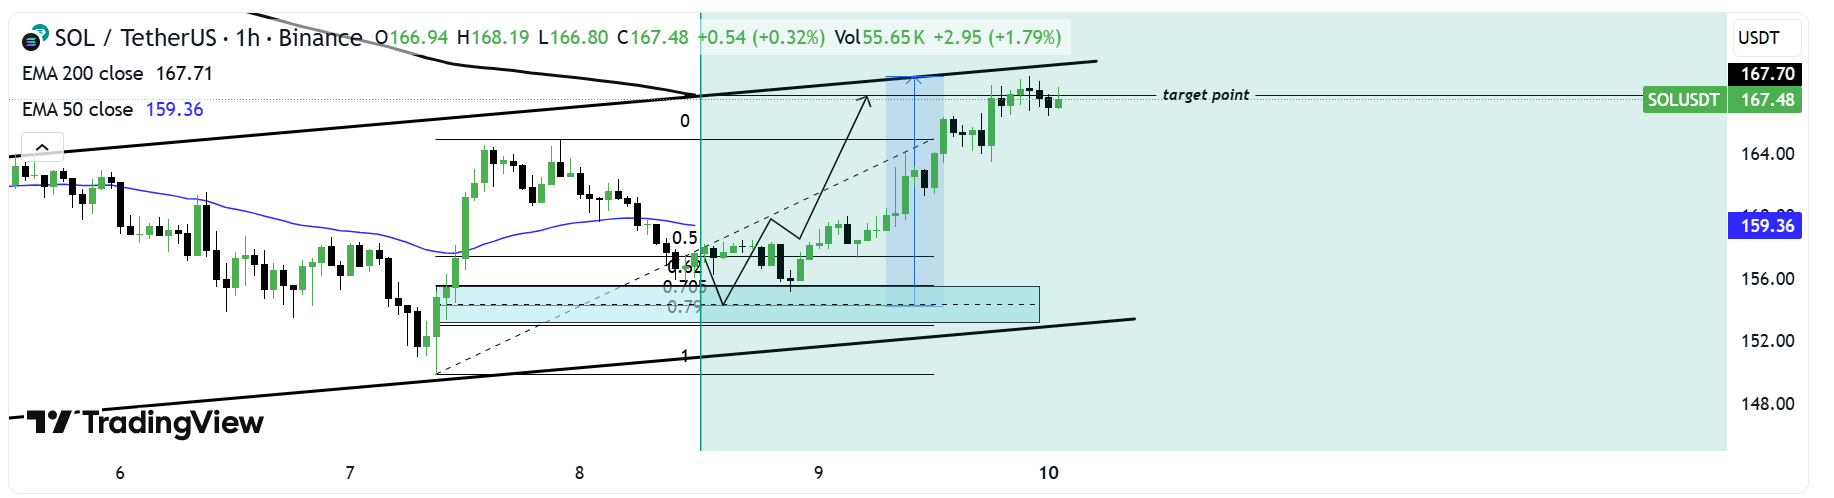
    Technical analysis of SOL/USDT (1-hour timeframe) — a potential continuation move within an ascending channel.
    Here’s the complete breakdown


    1. Market Structure

    Price is moving inside a rising channel, confirming a bullish structure with higher highs and higher lows.

    The two black trendlines outline this ascending pattern, indicating overall upward momentum.


    1. Key Zone (Demand Area)

    The blue box marks a demand or buy zone around $154–$155.5, aligned with the Fibonacci retracement levels (0.62–0.79).

    This zone represents a potential retracement area where buyers may step in to continue the uptrend.


    1. EMAs as Dynamic Support/Resistance

    50 EMA (blue line) = $159.36

    200 EMA (black line) = $167.71

    Price is currently below the 50 EMA but still above the mid-channel trendline, suggesting temporary correction before continuation.

    Once SOL bounces from the demand zone, reclaiming the 50 EMA would confirm momentum shift back to bullish.


    1. Expected Move

    The chart projects a short-term pullback into the demand zone (0.705–0.79 retracement).

    From there, a bullish reversal is expected, leading to a continuation toward the upper boundary of the channel.

    Target point: Around $167.7, matching the 200 EMA and channel resistance.


    1. Summary

    Trend: Bullish (ascending channel)

    Bias: Buy the dip / Continuation upward

    Entry Zone: $154 – $155.5 (blue demand zone)

    Target: $167 – $168

    Invalidation: Break below channel support (~$150)

    1 Reply Last reply
    0
    • Abdul KhanA Offline
      Abdul KhanA Offline
      Abdul Khan
      wrote last edited by
      #2

      SOL holding strong above key EMAs — momentum looks intact for now. 💪

      1 Reply Last reply
      0
      • Rimon KhanR Offline
        Rimon KhanR Offline
        Rimon Khan
        wrote last edited by
        #3

        As long as SOL keeps higher lows, trend bias stays bullish. 🔥

        1 Reply Last reply
        0


        • Login or register to search.
        Powered by NodeBB Contributors
        • First post
          Last post
        0
        • Categories
        • Recent
        • Tags
        • Popular
        • World
        • Users
        • Groups