


GOLD WEEKLY CHART MID/LONG TERM ROUTE MAP
-
Hey Everyone,Weekly Chart Update – 3387 Tested, Channel Top Rejected
Quick follow up on our Weekly Chart roadmap – price continues to respect the structure with precision.
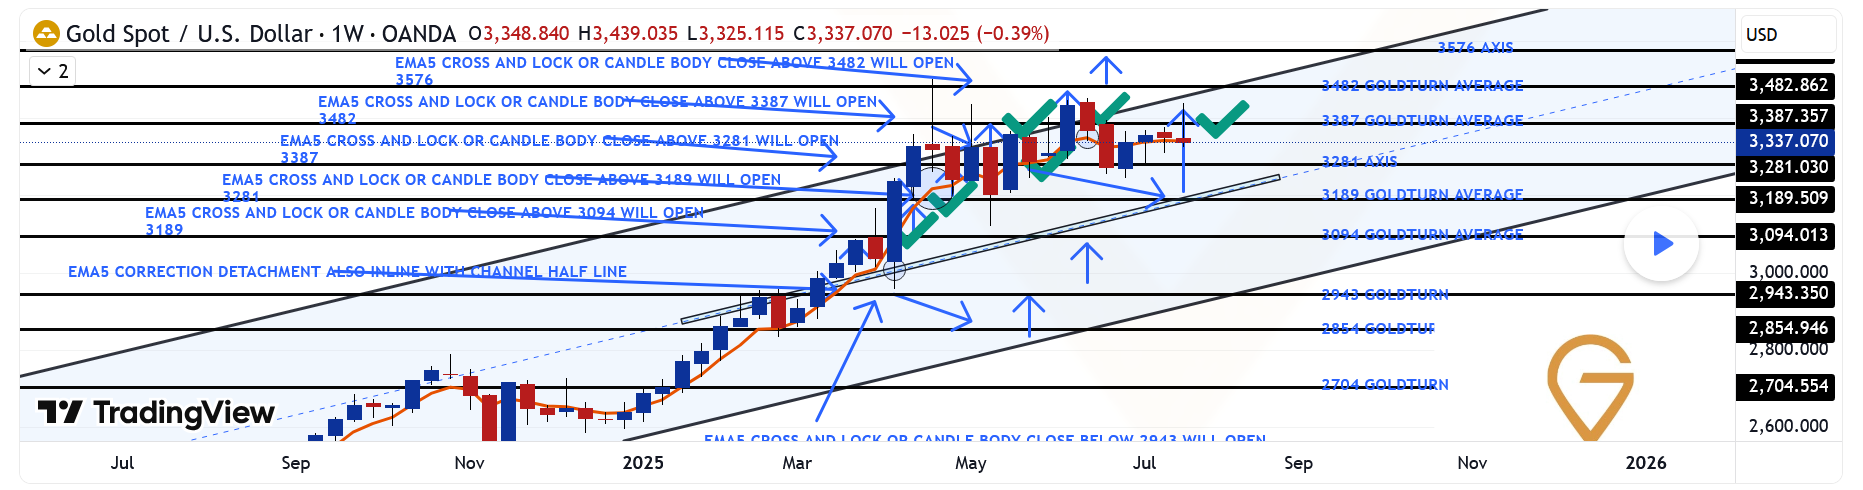
As anticipated, we got the test of 3387, completing the short term magnet move we've been tracking. That level aligned perfectly with the channel top, and true to form, we saw a clean rejection right on cue just short of the full channel top leaving that open.
Importantly, there was no close or lock above that zone, reaffirming it as valid resistance for now. As a result, the range remains active, with price still oscillating between 3281 support and 3387 resistance.
Key structural notes:
 Structure remains intact
No weekly close above 3387, no breakdown below 3281. The rising channel is still fully respected, and EMA5 has yet to turn bearish. 3281 Holding Strong
This level continues to act as a key weekly pivot. As long as it holds, we maintain a constructive outlook within the current range. 3387 Tested + Rejected
First test gave us the expected reaction. Until we see a confirmed close above, it remains the top of the current range.Updated Levels to Watch:
 Support – 3281
Weekly pivot and current range low. Still our key area for dip buys within this structure. Resistance – 3387
Now tested and confirmed. No break or lock above = valid rejection level. Resistance 2 – 3482
Unfilled weekly gap. Still the broader target, but we need a proper breakout above 3387 first.Plan: We continue to treat 3281–3387 as the active weekly range. If 3281 fails, we reassess at the midline of the channel. If 3387 breaks and holds, we shift focus toward 3482.
Thanks again for all the incredible engagement and support, it means a lot to us here at GoldViewFX. Stay focused, stay disciplined.
#trading #trade #BTC #USD #XAUUSD -
Gold has entered a crucial consolidation zone on the weekly chart. RSI recently touched oversold territory and is rebounding—early signs that downside momentum might be weakening.
Meanwhile, indicators like MACD and Bollinger Bands maintain a medium-term bullish outlook, signaling a potential breakout. If price holds above the $3,330–$3,350 zone, we could see an extension toward $3,500. But a failure at that level might lead to a retest of $3,280–$3,300.
 A solid chart structure forming—but we need volume confirmation before calling the next leg.
 -
Strong TA here—and fundamentals could drive gold even higher. Goldman Sachs sees gold reaching $3,700 or more by mid-2026 if recession risks unfold. Central banks are stacking reserves, and investor sentiment toward fiat currencies is weakening.
On the flip side, Citi expects gold to drop below $3,000 by late 2025 due to rising optimism around U.S. growth and reduced investor fear.
Smart play? Use these projections to adjust exposure. If price breaks $3,350 on strong volume, that’s a high-conviction entry zone—but keep stops just under $3,300 in case of reversals.
