


BITCOIN → Correction within a downward channel. 112K or 125K?

-
BTCUSDT is consolidating. However, a local downward trading range is forming relative to the current setup. What is the probability of a correction continuing to 112K or growth to 125K?
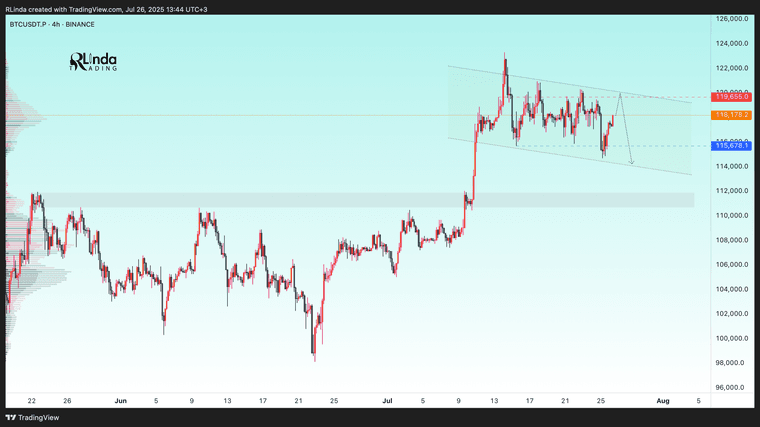
Daily structure: a local correctional channel within a global bullish trend. We have cascading resistance at 119.2, 119.6, 120, and 120.8. It will be quite difficult to break through this zone on the first attempt, but MM can use it to form traps and collect liquidity.At the bottom, everything is simpler — a breakdown of the local bullish structure, the formation of an intermediate minimum, below which there is a void down to 112K.
Yesterday, relative to 115-116K, mm staged a massacre (trap) on both sides of the market.
Liquidity collection, return to the range, and growth. The reaction to the false breakdown of support is quite strong. Since the opening of the session, Bitcoin has been heading towards resistance, but there may not be enough potential to break through the upper resistance conglomerate, so I expect to see a pullback or decline to 116-115-114.Resistance levels: 119.2, 120.1, 120.85
Support levels: 116.37, 115.67, 112Technically and fundamentally, I do not see any drivers that could support the market (I am talking about Bitcoin, since the driver for altcoins is the decline in Bitcoin's dominance). It is possible that this may appear later. In the current situation, I am considering a false breakout and correction, as the market has not yet finished consolidating or correcting, and the current downward trading range may be extended.
PS: As the price moves towards resistance, it is necessary to monitor the reaction. The market itself will show what it is preparing for...Best regards,
-
Well articulated scenario breakdown. Bitcoin is currently trading inside a well-defined descending channel—a classic corrective structure marked by lower highs and lows. Resistance is stacking between $119.2K, $120K, and $120.8K, creating a tough zone for bulls to break through on the first attempt. Should sellers dominate, there’s a clear price path down to $112K, once the intermediate low is breached.
Meanwhile, on-balance volume (OBV) has diverged positively—suggesting hidden buying pressure beneath the surface. If a breakout materializes, bullish momentum may push toward $125K or higher.
Bottom line: It’s a classic wait-for-confirmation moment—watch for a clean breakout above the resistance cluster with volume support, or a breakdown below key support levels to validate the lower target. -
Smart breakdown of current structure. The daily chart supports the idea that Bitcoin is stuck in a local correction within a broader bullish trend. Market makers may be using the $119–$120K zone to trap liquidity before pushing price lower into the $115–$112K support range.
That said, shallow dips are still possible if price holds above $116K–$115K, especially if short-term holders stay in profit and sentiment stabilizes. But failure to reclaim resistance could open the door to the deeper $112K downside.
Tip for traders: Monitor volume and momentum closely. A breakout above $120K could trigger a rally toward $125K or beyond, while a clean close below $115K–$114K may confirm the down-leg toward $112K -
Excellent observation on the cascading resistance from 119.2K to 120.85K. That congestion zone is a prime spot for MM liquidity traps. If BTC can't break it cleanly on the first try, I wouldn’t be surprised to see multiple fakeouts to shake out both longs and shorts before the real move. Watching reaction volume closely at each resistance level will be key
-
Totally agree on the downside risk. That ‘void’ below the local bullish structure is dangerous—if we drop below 115K decisively, there's a real possibility of fast acceleration to 112K. The lack of strong support in that range could trigger panic selling or automated liquidations."