


DXY (US Dollar Index): Seen in a Weekly Chart Perspective
-
DXY (US Dollar Index): Seen in a Weekly Chart Perspective
The chart shows DXY is sitting on a long-term ascending support line that has held multiple times since 2015. Price recently tested this support again near 96.37, making it a key level.
Price is around 97.70, close to support. This zone is crucial: as long as it holds, the bias remains for a bounce.
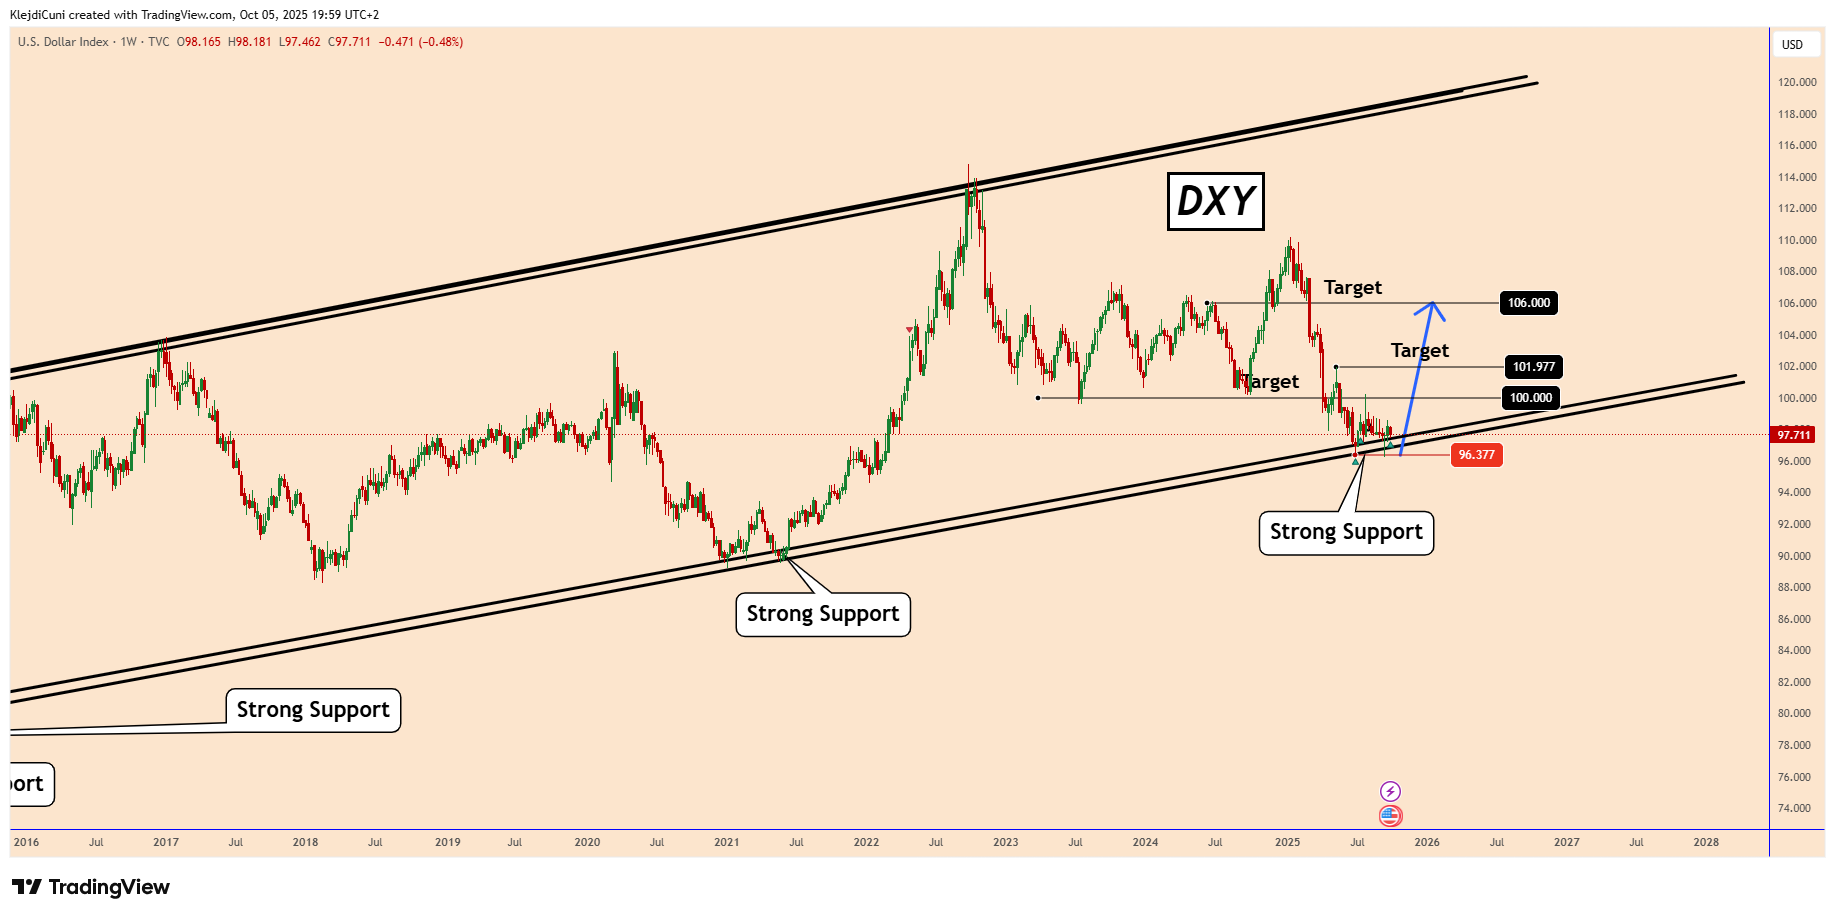
 Key Targets:
First target: 100.00 (psychological target)
Second target: 101.97
Third target: 106.00If DXY breaks and closes below 96.37, it could invalidate the bullish outlook and open space toward 94.00–92.00 levels.
The Dollar Index is at a critical support zone. If buyers defend this area, we could see a rebound toward 100–106. But if support fails, further downside could follow.
You may find more details in the chart!
Thank you and Good Luck!