


USD/JPY - Wedge Breakdown |Watch 150.00 & 148.00
-
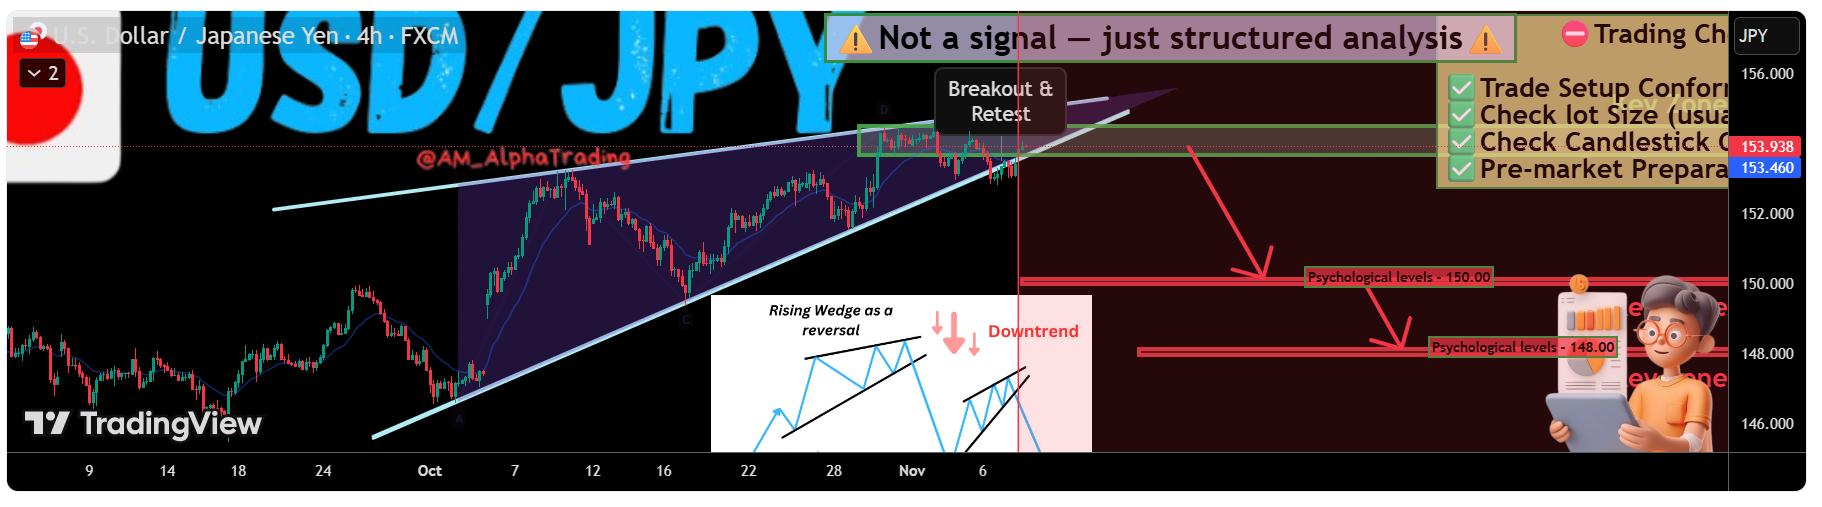
 USD/JPY Analysis – H4 Chart - Rising Wedge Breakdown Potential
Price is currently respecting a Rising Wedge structure, showing signs of exhaustion near the Key Zone (≈154.20–154.70). We’ve seen a break + minor retest, indicating possible bearish continuation if sellers maintain pressure.
A drop toward the Psychological Level – 150.00 remains likely, followed by a deeper move into the 148.00 Key Zone if momentum continues.
Market Context:1️⃣Downward structure building inside the pattern.
2️⃣Sellers are showing strength near support levels.
3️⃣Breakdown below the trendline indicates momentum continuation toward lower zones.Trade Plan:Entry: Sell after confirmed breakdown below the support (Candle close below trendline or retest of the breakout).
 Take Profit (TP): At the Key Zone – major support area identified ahead.
 Stop Loss (SL): Above the pattern structure / recent swing high.Psychological Discipline:
1️⃣Stick to plan – No Revenge Trades.
2️⃣Accept losing trades as part of the strategy.
3️⃣Risk only 1–2% of your account balance per trade. Support this analysis with a
LIKE | COMMENT
  | FOLLOW
It helps a lot & keeps the ideas coming! ️ Disclaimer: This analysis is for educational purposes only and does not constitute financial advice. Forex trading involves high risk. Trade only with capital you can afford to lose and always do your own research.
 -
Key support levels ahead — if 148 breaks, we might see a sharper correction.

-
JPY strength finally showing after months of USD dominance. Patience pays here. 🧘
 ️
️